Category | Other
Last Updated On 21/05/2025

Irrespective of what profession you come from, if your business or service has a customer then you are definitely analyzing data. This analysis is the root of your confidence for future developments. In this article, I will deep dive into the process of analyzing data and ways in which most can be brought out of it. Let’s deep dive.
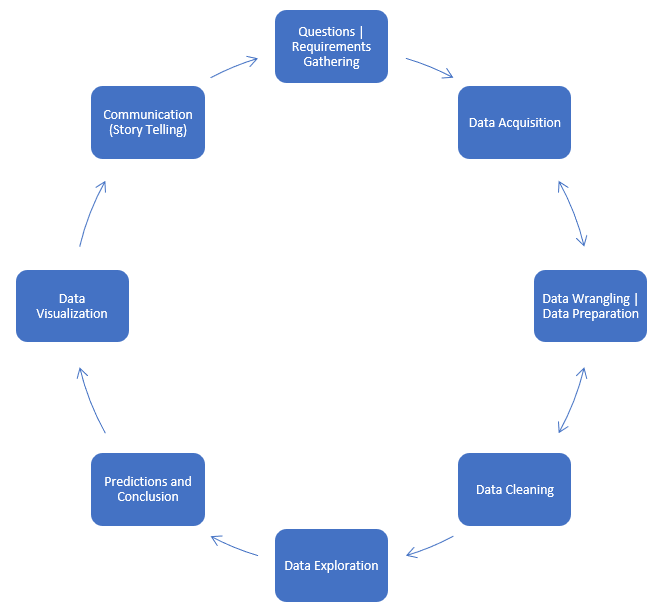
Data Analysis is not associated with just technology-based companies working in Silicon Valley. It is a part of every industry and runs for all products. Medicines, Grocery, Colleges, Weather Stations, and almost all industries that you can think of work with lots and lots of data on an everyday basis. I will be explaining and going through a typical walk-through of how the data analysis process works. Although, these steps are not exhaustive and may not occur in the same straight line order as mentioned. This is just to outline the overall picture of how Data Analysis as architecture would look like.
The general mindset of solving any analytical problem is looking at it through the eyes of a hypothesis test’s outcome. What is hypothesis testing? It is the procedure of validating the outcome, which starts with the result. We form a result (known as the hypothesis) and then solve the problem to prove that the hypothesis was true. Similarly, when solving an analysis problem, we start with the decision, with what is needed in the outcome, and then form our strategy to reach this outcome. It is always a great idea to constantly revisit this outcome and introspect whether the approach is correct. The raw flow goes something like this, we start with defining decisions and required outputs from the analysis. Then comes the analysis methods that can be used and what data requirements are there for the project. The next step is sourcing the data, collecting and storing it in a single accessible location, and further using it to perform the analysis. This approach generally answers questions about the project’s feasibility.
Understanding the requirement is key. It is important to find out what is kind of business problems that you are looking to answer and the KPIs that you are intending to measure. The next step is to plan the way forward. A very useful tactic that I would recommend is taking some time to figure out the data pointers from the information given to you. These data pointers are the performance indicatives that will form the set of information you need to focus on. It is important to ask specific questions. This phase builds a foundation for your data analysis solution as well. Note down the key areas from the data that you think would make a difference in decision making. Once, that is done and understood you could now move to Data Exploration and collection.
A major part of Data Acquisition gets covered during the loading up the data and performing the first two steps. But, acquisition as a process is a lot more than just taking the data from a resource to your workspace. There has always been a terminological confusion regarding the acquisition. First, “data acquisition” is sometimes used to refer to data that the organization produces, rather than (or as well as) data that comes from outside the organization. This is a fallacy because the data the organization produces is already acquired. So, we take into consideration only the data that we will capture from other sources and processes.
An important step for this is the identification of source and type of data. Data can many times be moved from a cloud service to localhost, or come from an API call. My recommendations would be, if the data source is on the cloud and it is static data (constant for a time frame and does not change) in that case it would be a good move to download the data locally for that time frame, perform the analysis and publish the report. On the other hand, if the data is a continuous stream (refreshing data) I would recommend performing the analysis on the cloud itself.
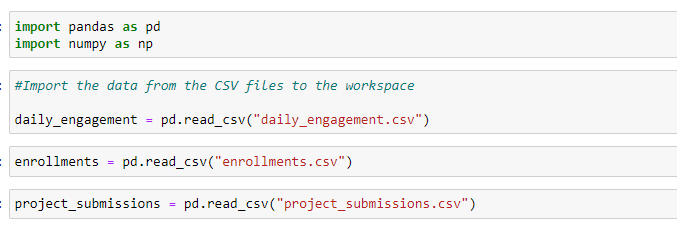
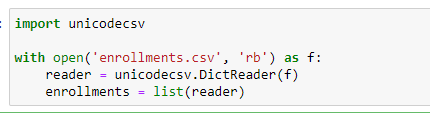
According to a report by Aberdeen Group, data preparation “refers to any activity designed to improve the quality, usability, accessibility, or portability of data. This step starts with the collection of data and importing it to your workspace. From here on, since there is a possibility of actually showing you up with data, I am using a data-set to explain further steps. It will start by taking the data in formats that most code will understand. If you are using a Query-based program to work with data, any SQL syntax should work fine. I will proceed further with Python on a CSV file. One important thing to note here is, data is CSV, and TSV formats are easier for Python, R to understand and interpret. At the same time, these formats can be easily run on Excel to visualize, but at the same time, an XLS formatted document is difficult to understand and run. There are various statements you could use to load the data onto your Python environment.
Once the data is imported, some methods help in getting to understand the type of variables present, the amount of data that is available. This can be done using some Pandas functions like, “DataFrame.Info()” or “DataFrame.head()”. The next step is to try and find anomalies in this data. These anomalies could be things like blank columns, or missing values, or in some cases outliers. The concept of handling outliers is very different for many analysts and dealing with them would also mainly depend on the problem at hand. Sometimes it might make sense to delete the outliers and sometimes we might want to create a standardized form for all the columns to bridge the outlier, something taking the Standard Deviation and Variance. The general rule here is, if the data point is 3 SD away from the mean of the data, it is recommended to ignore that outlier and not consider it for further analysis.
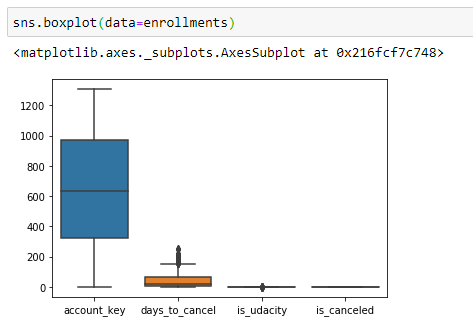
The Data Cleaning portion initializes some of the Visualization libraries to check for data discrepancies. This is important because outliers can wildly cause misinterpretation of the analysis we make. There are some common libraries within Pandas, Matplotlib, and Seaborn that can be used for identifying these outliers. Let us look at some of the code that would determine if there are values in the data that need cleaning. I am explaining two parts of realization here, one is finding missing values and another is finding outliers.
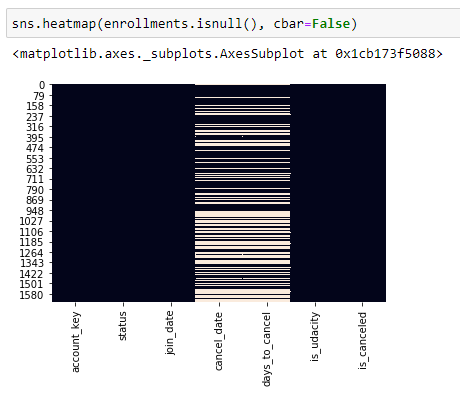
To find missing values we can use the below function: IsNull() or isna() The following heat-map shows data points that show up null in the columns. This can be then filled up using imputation techniques like mean/median imputation (although, mean imputation is not considered for production-level code)
Another important technique to read between the lines of the mentioned data is to draw a Box-plot. These plots often reveal a lot of information about the data we are trying to work on and can easily be used to identify risk factors like skewness in data and outliers within the data.
The interpretation of box-plots can be done in the following way:
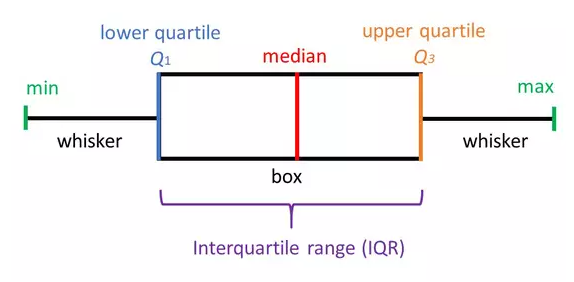
Minimum Score: The lowest score, excluding outliers (shown at the end of the left whisker).
Lower Quartile: Twenty-five percent of scores fall below the lower quartile value (also known as the first quartile).
Median: The median marks the mid-point of the data and is shown by the line that divides the box into two parts (sometimes known as the second quartile). Half the scores are greater than or equal to this value and half are less.
Upper Quartile: Seventy-five percent of the scores fall below the upper quartile value (also known as the third quartile). Thus, 25% of the data are above this value.
Maximum Score: The highest score, excluding outliers (shown at the end of the right whisker).
Whiskers: The upper and lower whiskers represent scores outside the middle 50% (i.e. the lower 25% of scores and the upper 25% of scores).
The Interquartile Range (or IQR): This is the box plot showing the middle 50% of scores (i.e., the range between the 25th and 75th percentile).
Handling skewed or missing data will change course based on different business scenarios. As I explained the general rule earlier, any data point exceeding the threshold of 3 Standard Deviations can be removed as that is a straight outlier case that cannot be resolved. For imputation, there are many techniques used, like Mean Imputation, Hotbox imputation, etc.
Exploratory analysis of data is not just fascinating but it is also one of the best forms to gather the architecture and dependencies within the Data. This phase can or at times cannot be associated with the primary problem at hand, but nonetheless still has a place in my clean architecture of an analysis solution. The primary reason for this is that use cases formed from the business requirements more often than not answer all the questions, although at times there might be some portions of data that we miss out. This data may or may not be required for solving the problem at hand but will be very useful to grasp the structure of that data set.
This can consist of various steps and charts that you can use to analyze data and explore connections and meanings between different data values present. The aim here should be to thoroughly understand the working of tabular columns and the values they hold. This is the phase that is preceded by the actual prediction analysis and drawing conclusions, so it should be utilized for cleaning up all forms of doubts present with regard to the data that is being analyzed. I am listing down a few basic plots that can be used and what derivatives can be drawn from them.
Drawing up graphs like Box plots, distribution plots, and scatter plots will show you how the curve of data looks like, where it is skewed and what the possible outliers could be. Pareto charts and histograms can help in analyzing what the confidence intervals of the data are and what is the most common occurrence of values. If the data is multidimensional and varied beyond theoretical recognition, we could use something like Principal Component Analysis (PCA) to perform dimensionality reduction.
We are slowly coming towards the end of the process since most of the analysis has now concluded, but the solution is still not complete. One important aspect to consider here is that for any data analysis solution; the delivery of the solution will often more than not, not be given to another data analyst. So, the conclusions that we draw from the data needs to come in a language that most people understand. This can be perfected during the visualization phase but nonetheless, the easier things are to understand, the better presentation will be. Coming to predictions made from the data, make sure the prediction is made only and only based on the requirements from the first step. Seldom analysts like to visualize additional information, assuming that lots of data would be a good prediction. Theoretically, that might prove that you have done a great job during the analysis but at the end of the day if the consumer does not need the additional data it will not be of any use. So, one important point to remember is to keep things as simple and crisp as possible.
We now come to the last sections in the architecture and data visualization is more like adding an additional layer of validation to the communication that your data is going to give. Now, visualization in itself is a tremendous step, encompasses many concepts, and could also have an architecture of its own. The depth of this can be understood by realizing that Data Visualization in itself is a full-time job, unlike all the other steps of the architecture diagram.
I have created a separate story explaining how important data visualization actually is, I would recommend going through that.
https://medium.com/analytics-vidhya/the-science-of-data-visualization-995e45238354
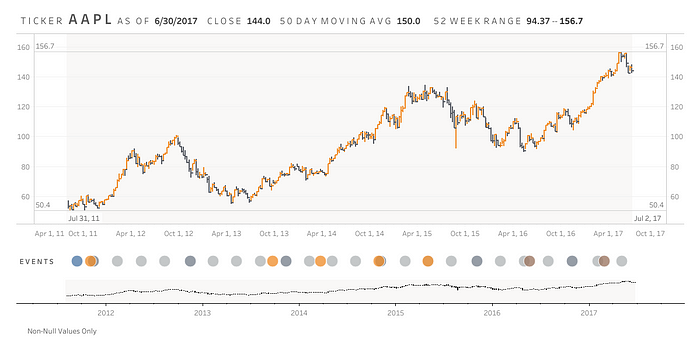
Although data visualization covers most of the graphical message of the analysis the last portion of the architecture is the art of storytelling. Once the analysis, predictions, and visualization is completed we return to base 1 of the mission that is gathering requirements and understanding the question that we need to answer. Communication involves giving the end-user that answer. In the path of reaching this conclusion, we might have come across various segments of data that need not be put into the conclusion. The best form of giving the result in my opinion is a one-page or to a maximum a two-page reporting dashboard. [2] This report would contain precise, to-the-point answers to the question that we were solving and only the data that the end-user needs. The language used during this communication should be built with the standpoint of the business user and not a data scientist. There a few tools that can be used to convey this message in a creative manner — tableau, adobe analytics are some really great dashboarding tools. I will be creating a separate article for how the art of storytelling should be commenced. But, in the mean-time let me show you a few examples of great dashboards.

Web Analytics dashboard image on Unsplash by Luke Chesser
It is not always necessary to use strong tools and complex algorithms to solve data analytics problems. Although, when required many tools will provide you with advanced techniques and options, but at the cost of over-complication. One disadvantage of complicating solutions is representing these results to stakeholders. The more complex your procedure is, the more difficult it will be to present it forward.
The current state of data-driven projects need a change and since the Agile framework has done wonders for software engineering, it is time to adopt an iterative approach to solve Data Science problems as well. I believe this proposed solution helps ease out the life cycle of the project and has so far worked shown clear results for me.
Let me know what you think about following an architecture for doing data science projects in the comments below, or connect with me on Twitter.
References:
[1] Details about box plots and interpretation — https://www.simplypsychology.org/boxplots.html
[2] Tableau Blogs for single page reporting dashboards — https://www.tableau.com/about/blog/2017/7/viz-gallery-contest-winners-prove-visual-analytics-art-73390
Clean Architecture provides a structured, maintainable, and scalable approach to data analysis. By separating concerns, enforcing boundaries, and decoupling business logic from frameworks and tools, it ensures that analytical systems remain adaptable to change and easier to test and extend. Whether you're building data pipelines, designing analytical dashboards, or deploying machine learning models, adopting clean architectural principles enhances code quality, improves collaboration among teams, and drives better, more reliable insights. In a world increasingly driven by data, clean architecture isn’t just a best practice—it’s a competitive advantage.
Take the next step in your career with our Certification in Data Architecture & Analysis. Learn how to design scalable, maintainable systems grounded in clean architecture principles.
Author Details

Confused About Certification?
Get Free Consultation Call
Stay ahead of the curve by tapping into the latest emerging trends and transforming your subscription into a powerful resource. Maximize every feature, unlock exclusive benefits, and ensure you're always one step ahead in your journey to success.