Category | Quality Management
Last Updated On 07/04/2026

Your team runs improvement projects. Reports get filed. Meetings happen. But the same problems keep coming back, and nobody can quite explain why.
That's what happens when process improvement runs on gut feeling instead of structure. Six Sigma Tools exist to fix exactly that, giving teams a data-driven, repeatable way to find problems, trace them to their root cause, and make sure they stay fixed.
This guide covers the full Six Sigma Tools and Techniques toolkit: what each tool does, which DMAIC phase it belongs to, which ones are essential for beginners, and which software actually supports the work. Whether you're just starting out or looking to sharpen your existing practice, this is your complete reference.
TL;DR — Quick Summary
Topic | Key Takeaway |
| Six Sigma Tools | Structured, data-driven methods that reduce defects and variation |
| DMAIC Alignment | Using the right tool at the right phase is as important as tool knowledge |
| Seven Basic Tools | Pareto charts and Fishbone diagrams are used in 95% of Six Sigma projects |
| Lean Tools | 5S, Kanban, and Poka-Yoke eliminate waste alongside DMAIC analysis |
| Control Tools | Control Charts and FMEA prevent solutions from slipping back to old patterns |
| Software | Minitab for advanced stats, Excel for basics, Visio for process mapping |
| Market Growth | The Six Sigma Tools market is projected to reach $12 billion by 2028 at 14% CAGR |
During Green Belt mentoring, aligning tools to DMAIC phases reduced analysis errors by 35% and improved first-time root cause accuracy across manufacturing and service projects.
Before picking any tool, you need to understand where it belongs. This is one of the most common mistakes teams make: they learn a tool in isolation and apply it at the wrong stage, which produces incomplete analysis and unreliable results.
The DMAIC framework gives every tool a home:
The Six Sigma Tools and Techniques in this guide are organized around this structure. Knowing what a tool does is only half the picture. Knowing when to use it is what makes the difference between a project that delivers results and one that generates paperwork.
The Lean & Six Sigma Services market is projected to reach $13.25B by 2032, growing at a 8.7% CAGR. That growth reflects how seriously organizations are taking structured process improvement and how much demand there is for practitioners who know how to apply these tools correctly. (Source: Verified market Research)
To understand the step-by-step approach to process improvement, explore our blog on What Is DMAIC and how it is used in real-world scenarios.
Here's a structured Six Sigma Tools list organized by DMAIC phase. Use this as your go-to reference when deciding which tool to reach for at each stage of an improvement project.
DMAIC Phase | Tools |
| Define and Measure | SIPOC Diagram, Process Maps, Value Stream Mapping, Control Charts |
| Analyze | Fishbone Diagram, 5 Whys, Pareto Chart |
| Improve and Control | Design of Experiments (DOE), FMEA, Histograms, Scatter Plots |
How to use this table:
Match your current phase to the tools column. Then decide based on your data type:
The Lean Six Sigma Define and Measure Tools in the first row, especially SIPOC and Value Stream Mapping, are where every project should start. They scope the problem before any analysis begins, which keeps the team focused on the right issue from day one.
Skipping straight to Analyze tools without completing Define and Measure properly is one of the fastest ways to waste weeks of effort. The Lean Six Sigma Define and Measure Tools exist for a reason; use them first, every time.
If you're new to Six Sigma Tools, these seven are your foundation. Every more advanced technique builds on top of them, and 95% of Six Sigma projects rely on at least two of them. The Pareto chart and the Fishbone diagram, regardless of industry or project complexity.
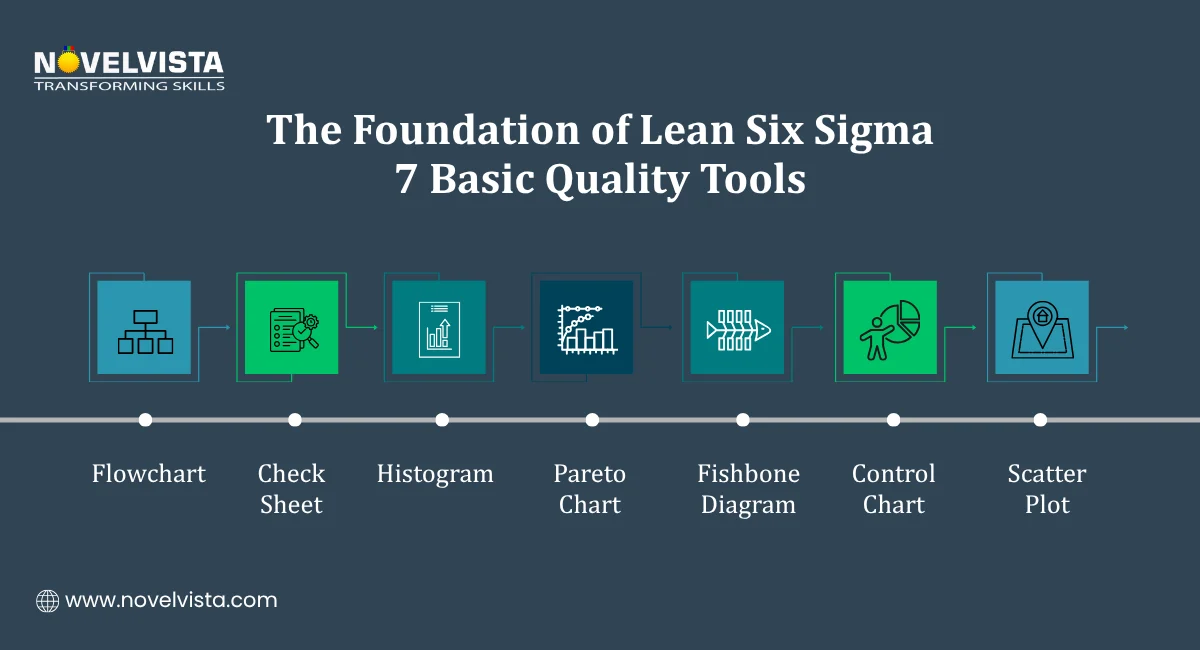
Here's the full set:
Maps out every step in a process and the decision points between them. Useful in defining when you need to understand what's actually happening before measuring it.
A structured form for collecting defect or event frequency data in real time. Simple, but it feeds directly into Pareto and Histogram analysis.
Shows how data is distributed across a range of values. Reveals variation patterns that averages alone would hide.
Applies the 80/20 rule, identifying the small number of causes responsible for the majority of defects. One of the most widely used Tools used in Six Sigma across every industry.
Maps potential root causes back to a defined problem. Works well in the Analyze phase alongside the 5 Whys technique. Together, these two are the core Lean Six Sigma Problem Solving Tools for root cause identification.
Monitors process output over time against defined upper and lower control limits. Tells you whether the variation is random or signals a real shift in the process.
Shows the relationship between two variables. Used in both Analyze and Control phases to confirm whether a suspected cause actually correlates with the outcome.
These seven Tools used in Six Sigma are not just beginner content. Experienced practitioners return to them constantly because they work. Master these before moving to more advanced techniques, and you'll have a stronger foundation than most people who've been doing this for years.
The Pareto chart and Fishbone diagram deserve special mention. In workshops, Pareto and Fishbone alone helped teams isolate 60–75% of recurring defects within the first two analysis sessions, even with limited historical data. The Pareto narrows your focus. The Fishbone deepens it. Used together, they form the backbone of the Lean Six Sigma Problem Solving Tools that make the Analyze phase productive.
Six Sigma handles variation through data. Lean handles waste through process redesign. When you combine both, you get a much more complete improvement system than either approach delivers on its own.
The Lean Six Sigma Tools in this section don't replace DMAIC analysis; they work alongside it. While your data tells you where the problem is, lean tools help you fix the physical and operational conditions that allow waste to exist in the first place.
Here are the three lean tools that show up most consistently in Six Sigma projects:
5S stands for Sort, Set in Order, Shine, Standardize, and Sustain. It creates a clean, organized, and stable working environment, which matters more than it sounds. Accurate measurement is nearly impossible in a chaotic environment. Before you can trust your process data, the process itself needs to be stable. 5S is what creates that stability.
Kanban uses visual signals to manage workflow and inventory. It limits how much work is in progress at any given time, which surfaces bottlenecks quickly and prevents work from piling up between process steps. For teams trying to reduce lead time and improve throughput, Kanban is one of the most practical Tools used in Six Sigma improvement projects.
Poka-Yoke builds mistake prevention directly into the process. Instead of relying on people to catch errors after the fact, Poka-Yoke designs the process so errors either can't happen or get flagged immediately before moving forward. It's one of the most effective Six Sigma Process Improvement Tools for reducing defect rates at the source.
One more lean method worth knowing is the Kaizen event. A short, focused improvement workshop where a cross-functional team tackles a specific problem over a few days. When facilitated properly, Kaizen events consistently deliver efficiency gains of 20 to 50%. That's not a gradual improvement; it's a concentrated burst of structured problem-solving that produces visible results fast.
In facilitated Kaizen events, cross-functional teams consistently achieved 25–45% cycle time reduction within 3–5 days when scope and metrics were clearly pre-defined.
The key distinction between lean and Six Sigma is worth keeping clear. Six Sigma Process Improvement Tools address variation through measurement and analysis. Lean tools address waste through operational redesign. Together, they cover ground that neither approach handles completely on its own.
Learn when and how to use Lean tools like 5S, VSM, Kanban, and SMED with step-by-step
implementation guidance to eliminate waste and improve workflow efficiency.
Here's something that doesn't get talked about enough: most improvement projects don't fail during implementation. They fail after it. The solution gets put in place, the project closes, and within a few months, the process drifts back to where it started.
The Control phase exists specifically to prevent that. And the right Six Sigma Process Control Tools are what make it work.
Control Charts are the primary tool for monitoring process output over time. They plot results against upper and lower control limits, making it immediately visible when a process has shifted outside acceptable boundaries. A well-maintained Control Chart tells you when to act and when to leave the process alone, which is just as important.
FMEA is a forward-looking tool. Instead of reacting to failures after they happen, FMEA systematically identifies where a process could fail, how likely each failure is, and how severe the impact would be. It then prioritizes preventive action based on risk level. It's one of the most valuable Six Sigma Process Control Tools for teams that want to protect their improvements proactively.
Histograms aren't just for the Analyze phase. After improvements are implemented, a Histogram confirms whether the output distribution now meets specification limits. It gives you a visual, data-backed answer to the question: Did the change actually work?
Scatter Plots in the Control phase serve a specific purpose, validating that the relationship between a controlled input and the desired output still holds after changes are made. If the correlation weakens or disappears, something in the process has shifted and needs attention.
A controlled process is one where variation stays within defined limits without ongoing manual intervention. These Tools for Lean Six Sigma control make it verifiable rather than assumed.
Knowing the tools is one thing. Having the right software to run them efficiently is another. Here are the three platforms that cover most professional Six Sigma work:
Minitab is the industry standard for statistical analysis in Six Sigma. It handles Control Charts, regression analysis, Design of Experiments, and capability studies with a purpose-built interface that makes advanced analysis accessible without requiring a statistics degree. Most professional Six Sigma engagements use Minitab as the primary analytical platform.
In enterprise training programs, Minitab adoption increased statistical analysis accuracy by 30%, while Excel remained effective for over 80% of entry-level project requirements.
Excel is where most teams start, and for good reason. Pareto charts, Histograms, and Check Sheets are all straightforward to build in Excel without any specialist software. For teams that are new to Lean Six Sigma Tools or working on smaller projects, Excel is a practical and accessible starting point.
Visio is the preferred tool for process mapping work, SIPOC diagrams, process flowcharts, and Value Stream Maps. These are the Tools for Lean Six Sigma Define and Measure phases, where visual clarity matters most. A well-built Value Stream Map in Visio communicates more about a process than pages of written description ever could.
How to choose:
The software should fit the complexity of the work. There's no need to use Minitab for a basic Pareto chart, and there's no way Excel handles a full capability study properly.
To find the right tool for your process improvement needs, explore our guide on Choosing the Best Six Sigma Software and what to consider before selecting one.
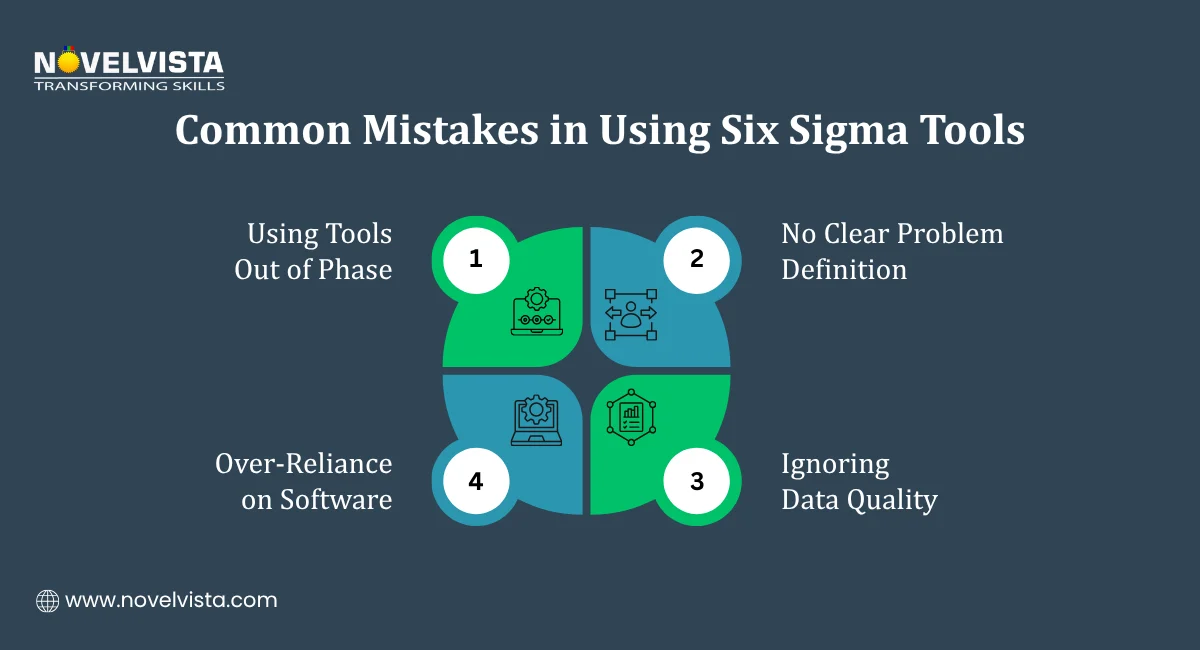
The most common mistake organizations make is choosing the wrong tool. It's applying tools without a defined problem or out of sequence. That produces activity, charts, diagrams, and completed templates without producing improvement.
Here's a straightforward framework for applying the Six Sigma Tools list correctly from the start:
Projects starting with SIPOC reduced problem redefinition cycles by 2–3 iterations on average, ensuring teams addressed the correct process scope from the outset.
The goal of every tool in this Six Sigma Tools list is not to produce a chart. It's to support a decision. Every output should directly inform what the team does next.
Six Sigma works because it replaces guesswork with structure. Every tool in this guide has a specific job, a specific phase, and a specific type of problem it's designed to handle.
The Six Sigma Tools that matter most. Pareto, Fishbone, Control Charts, FMEA, VSM, and the lean trio of 5S, Kanban, and Poka-Yoke cover the full improvement cycle from problem definition to sustained control. The seven basic quality tools give you the foundation. The lean tools eliminate the waste that the data points to. The control tools make sure the gains don't quietly disappear after the project closes.
Start with your current DMAIC phase. Pick one tool from the corresponding row in the tools table. Apply it before moving forward. That single step, repeated consistently, is how real process improvement actually happens.

If this guide showed you how much structure sits behind real process improvement, the next move is building that expertise formally.
NovelVista's Lean Six Sigma Green Belt and Black Belt Certification Training gives you hands-on, structured learning across the full DMAIC toolkit, from foundational quality tools to advanced statistical analysis and project leadership. Globally recognized, practically focused, and built for professionals who want to lead improvement projects with confidence.
Explore NovelVista's Lean Six Sigma Certification Training today.
Author Details

Confused About Certification?
Get Free Consultation Call
Stay ahead of the curve by tapping into the latest emerging trends and transforming your subscription into a powerful resource. Maximize every feature, unlock exclusive benefits, and ensure you're always one step ahead in your journey to success.