Category | Project Management
Last Updated On 15/10/2025
PMP formulas aren’t just math—they’re your project’s pulse. Numbers like CPI, SPI, EAC, and BAC don’t just sit on spreadsheets; they tell you if your project is healthy or heading for trouble.
Numbers don’t lie — they tell the real story of your project’s health. Whether you’re trying to calculate earned value management (EVM) or figuring out the EAC formula, PMP, these formulas give you a clear view of where your project stands — on time, on budget, or off track.
The PMP® certification, governed by the Project Management Institute (PMI), defines a globally accepted framework for project success. These formulas form the analytical backbone of that framework, empowering professionals to measure performance and forecast outcomes with precision.
This guide breaks down the most-used PMP formulas with simple explanations and examples, helping you connect theory to real-world project control. Plus, you’ll get access to a downloadable PMP Formula PDF Cheat Sheet — your go-to quick reference while studying or managing projects.
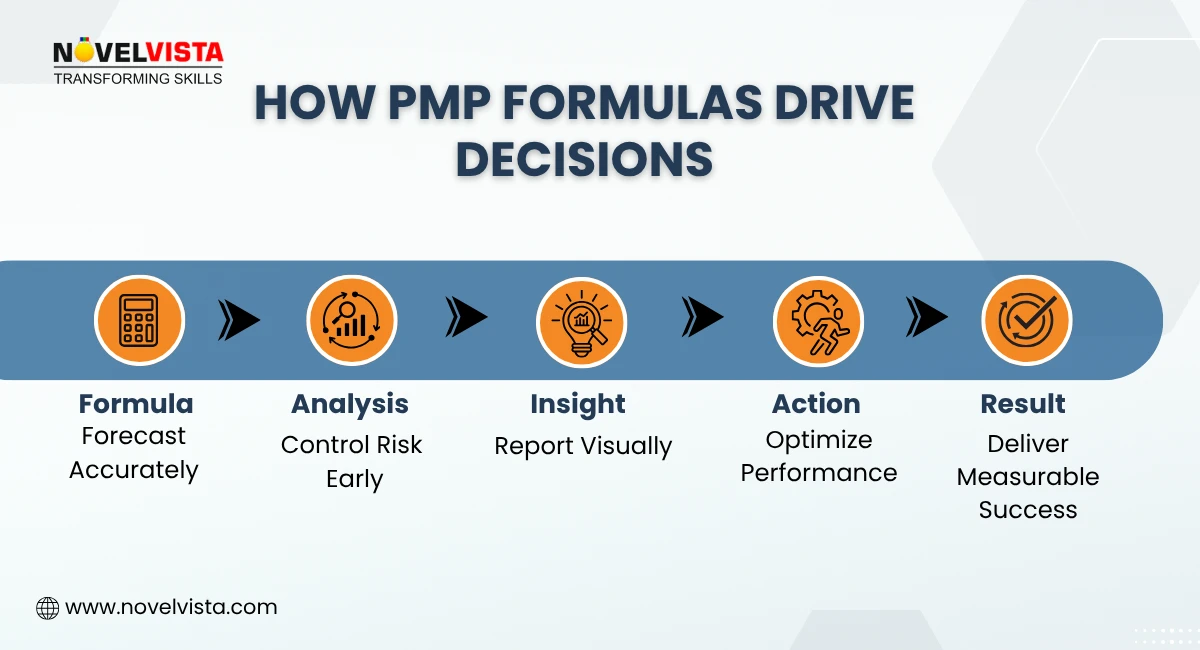
Think of PMP formulas as your GPS for project success. They help you forecast accurately, monitor progress, and stay in control of risks and costs.
Formulas play a vital role across all PMP areas — from defining baselines in the project charter PMP to analyzing performance using earned value management PMP. Each one supports better forecasting and smarter decision-making.
They connect directly with important PMP tools and documents, like:
Earned Value Management (EVM): Tracks project cost and schedule performance.
Project Schedule Network Diagram PMP: Maps dependencies to identify critical paths.
Requirements Traceability Matrix PMP: Ensures every project deliverable meets its intended goal.
Change Management Plan, PMP, and Configuration Management Plan: Help maintain control over baselines and changes.
Issue Log vs Risk Register PMP: Helps distinguish between what’s gone wrong and what could go wrong.
And don’t forget the PMP ITTOs (Inputs, Tools, Techniques, and Outputs) — these are the frameworks where all these formulas come alive.
Let’s decode the formulas that measure your project’s cost and schedule performance. These PMP formulas help you see if you’re spending too much or moving too slow.
Formula |
Meaning |
Expression |
Planned Value (PV) |
Value of work planned till date |
Defined baseline |
Earned Value (EV) |
Value of work actually completed till date |
— |
Actual Cost (AC) |
Actual amount spent till date |
— |
Cost Variance (CV) |
Budget difference between EV and AC |
CV = EV − AC |
Schedule Variance (SV) |
Progress gap between EV and PV |
SV = EV − PV |
Cost Performance Index (CPI) |
Cost efficiency of the project |
CPI = EV ÷ AC |
Schedule Performance Index (SPI) |
Schedule efficiency of the project |
SPI = EV ÷ PV |
Estimate at Completion (EAC) |
Predicted total cost of the project |
EAC = BAC ÷ CPI |
Variance at Completion (VAC) |
Expected cost variance at completion |
VAC = BAC − EAC |
To-Complete Performance Index (TCPI) |
Efficiency is needed to meet the project budget |
TCPI = (BAC − EV) ÷ (EAC − AC) |
Budget at Completion (BAC) |
Total approved project budget |
Defined baseline |
Example:
If EV = 400, AC = 500, and BAC = 1000 →
CPI = 0.8 (meaning you’re over budget), EAC = 1250, and VAC = -250.
In a recent IT infrastructure project for a financial client, applying EVM formulas (CPI and SPI) during mid-project reviews helped identify inefficiencies in vendor deliverables. Corrective actions based on CPI trends reduced budget variance by 12% and brought delivery back on schedule within two reporting cycles.
Master all 53 PMP formulas in one place.
Save time, boost accuracy, and
Pass your exam faster than everyone else.
Estimating accuracy can make or break your project schedule, PMP. The following PMP formulas help you forecast realistic timelines and manage uncertainty.
| Formula | Description | Expression |
| PERT (Beta Distribution) | Weighted average estimate | (P + 4M + O) ÷ 6 |
| Triangular Distribution | Simple average estimate | (P + M + O) ÷ 3 |
| Standard Deviation (SD) | Measures uncertainty | (P − O) ÷ 6 |
| Variance (σ²) | Spread of estimates | ((P − O) ÷ 6)² |
Tip:
Use three-point estimating during early planning to create realistic schedules. Combine it with risk data quality assessment PMP to improve confidence in your estimates.
Projects aren’t just about time—they’re about money too. These financial PMP formulas help you measure profitability, ROI, and financial feasibility.
Formula |
Purpose |
Expression |
Present Value (PV) |
Calculates the value of future money today |
PV = FV ÷ (1 + r)ⁿ |
Payback Period |
Time needed to recover the investment |
PP = Initial Investment ÷ Avg Annual Cash Flow |
Benefit-Cost Ratio (BCR) |
Compares benefits vs costs |
BCR = Revenue ÷ Cost |
Net Present Value (NPV) |
Measures project profitability |
NPV = Σ [CF ÷ (1 + r)ᵗ] − Initial Cost |
|
Expected Monetary Value (EMV) |
Quantifies risk impact | EMV = Probability × Impact |
Internal Rate of Return (IRR) |
It's the expected rate of return the project generates. |
NPV=∑t=0N(1+IRR)tCash Flowt=0 (Requires calculation via financial calculator or spreadsheet) |
Example:
If a risk has a 30% chance of costing $20,000 → EMV = $6,000 (expected cost impact).
Expert Insight:
Financial formulas like NPV and EMV aren’t limited to theoretical assessments — they play a critical role in investment and portfolio-level decision-making. Experienced project managers often integrate NPV and EMV results with sensitivity analysis or Monte Carlo simulations to strengthen business cases before executive approval.
Formulas don’t live in isolation — they connect directly with real project tools. Every number you calculate finds its place in a document or plan that keeps your project in check. Let’s see how these PMP formulas fit into daily project management.
Project Charter PMP: This is where it all begins. It defines the BAC in PMP — your approved budget and schedule baselines that every cost and schedule formula depends on.
Requirements Traceability Matrix PMP: Helps ensure project outputs meet defined scope and metrics. If the numbers don’t align here, it’s a red flag for quality or scope creep.
Configuration Management Plan: This one’s all about version control. It keeps track of baseline updates that impact formulas like EAC or TCPI PMP.
Change Management Plan PMP: Projects evolve, and so must your metrics. This plan defines how to manage schedule or cost changes after calculating SPI and CPI PMP.
Issue Log vs Risk Register PMP: Here’s where you separate what’s already happened (issues) from what might happen (risks). EMV calculations help you quantify risk costs before they become real problems.
Make or Buy Analysis PMP: Uses formulas like BCR, NPV, and payback period to decide whether to purchase or produce in-house.
Stakeholder Cube PMP: Evaluates stakeholder influence on cost and schedule priorities, helping you focus your reporting based on impact.
Each of these tools ties back to PMP ITTOs, ensuring that your formulas feed into project inputs, tools, and outputs that guide smarter decisions.
Formulas look good on paper, but they shine on dashboards. Visual tools transform your PMP formulas into patterns you can actually act on.
Burndown Chart PMP: Shows remaining work versus planned work. If your SPI is slipping, this chart makes it obvious.
Project Schedule Network Diagram PMP: Maps out task dependencies. It’s your visual guide to understanding how delays in one activity affect the overall schedule.
Glide Path PMP: Tracks performance improvement over time, revealing if your CPI or SPI is trending toward stability or trouble.
PMP Histogram: Displays cost or schedule distribution, helping you spot where resources are stretched too thin.
Visual tracking keeps the earned value management PMP numbers meaningful. Instead of just reporting CPI or SPI, you can show how trends change and where to focus next.
The S-Curve is the quintessential EVM visualization. It plots Planned Value (PV), Earned Value (EV), and Actual Cost (AC) against time.
If EV is above PV: Your SPI is greater than 1.0 (ahead of schedule).
If EV is below AC: Your CPI is less than 1.0 (over budget).
The Gap between PV and EV is your Schedule Variance (SV).
By looking at the S-Curve, a stakeholder can immediately see the project's pulse without calculating a single number.
Let’s bring it all together with a scenario you can relate to.
You’re managing a software rollout project. Halfway through, your CPI PMP formula shows 0.9 (slightly over budget), and your SPI drops to 0.85 (behind schedule). You calculate EAC using the EAC formula. PMP — the new projected cost overshoots by 15%.
You recheck the project schedule network diagram, PMP, and realize dependencies caused delays. After adjusting, you recalculate the TCPI PMP to see the efficiency needed to get back on track.
But you’re not done — you also run an NPV calculation, PMP, and EMV PMP formula on a new change request to check its financial and risk impact before updating your configuration management plan and change management plan PMP.
These numbers don’t just show problems; they guide decisions — when to reallocate resources, when to raise a change request, and when to stop a loss early.
The PMP exam doesn't just test your knowledge; it tests your ability to apply it. While you won't be required to memorize every single formula, a deep, conceptual understanding of a few core PMP formulas is absolutely essential. The formulas in this guide are critical for passing the exam, with two areas being tested more heavily than any others: Earned Value Management (EVM) and Estimating/Risk.
Formula Category |
Exam Focus |
Key Takeaway for the Test |
EVM (CPI, SPI, EAC, TCPI) |
Heavily Tested. You must understand the implications of the results (e.g., CPI<1 means over budget) and be able to calculate EAC using different scenarios (e.g., using BAC÷CPI or using a new estimate). |
Know your variance (CV,SV) and index (CPI,SPI) formulas cold. Focus on interpreting the results—a positive number is good for CV/SV, but an index (CPI/SPI) must be >1 to be good. |
| Estimating (PERT, SD, Variance) |
Moderately Tested. PERT (Beta) weighted average Standard Deviation (SD) as risk/uncertainty measure |
Memorize the PERT formula: (P+4M+O)÷6. Use the SD formula, (P−O)÷6, to gauge how much padding you need. |
Once you start using PMP formulas confidently, project control feels like second nature. Here’s what you gain:
Better Forecasting: You’ll predict costs, timelines, and risks more accurately using CPI, SPI, and EAC.
Stronger Risk Management: With tools like EMV and standard deviation PMP, you’ll make smarter calls under uncertainty.
Sharper Analysis: EVM and PERT connect real progress with planned performance — perfect for performance reviews.
Improved Reporting: You’ll communicate clearly with stakeholders using visual aids like burndown charts and histograms.
Exam & Career Boost: Understanding PMP formulas deeply prepares you for exam questions and helps you apply theory on the job with confidence.
These skills make you more than just a project manager — they make you a data-driven decision maker.

Formulas aren’t just exam content — they’re your everyday decision helpers. Whether it’s managing scope through your project charter, PMP, balancing budgets via EAC, or controlling risks through EMV, these PMP formulas keep your project running smoothly and predictably.
They bridge the gap between what you plan and what you deliver — giving you the power to track, adjust, and succeed.
Ready to make these formulas second nature?
Join NovelVista’s PMP Training Certification — where you’ll learn real-world applications of EVM, CPI PMP formula, SPI, and CPI PMP, PERT, NPV, and EMV through hands-on problem-solving and guided examples.
Author Details

Course Related To This blog
PRINCE2 Agile® Foundation
PMP Training Certification
Confused About Certification?
Get Free Consultation Call
Stay ahead of the curve by tapping into the latest emerging trends and transforming your subscription into a powerful resource. Maximize every feature, unlock exclusive benefits, and ensure you're always one step ahead in your journey to success.