Category | IT Service Management
Last Updated On 02/06/2026
In a world where every minute of downtime impacts productivity, the IT service desk has become one of the most critical business functions. Yet, many organizations still struggle to answer a simple question: Is our service desk actually performing well?
The numbers tell an interesting story. According to the 2025 Freshservice Benchmark Report, based on more than 187 million tickets across 10,000+ organizations globally, AI-enabled IT teams achieved a 76.6% reduction in ticket resolution time, improved first response times by 41.1%, and increased customer satisfaction scores to nearly 98%. At the same time, research from HappySignals' Global IT Experience Benchmark analyzed over 1.77 million employee feedback responses and found that employees still lose an average of more than 3 hours per incident due to IT-related disruptions.
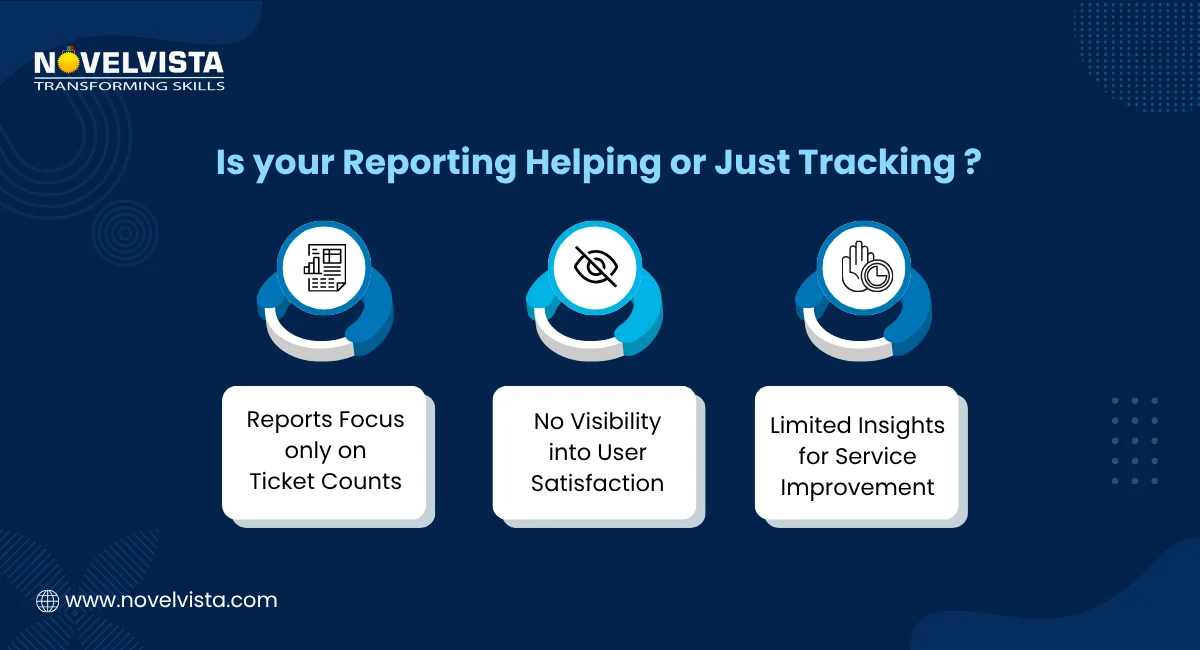
According to industry research, organizations with mature IT service management practices experience significantly higher service quality, improved customer satisfaction, and reduced operational costs. Yet many service desks still struggle to measure performance effectively. They generate reports filled with data but lack actionable insights.
Have you ever wondered:
These questions highlight why effective Service Desk Reporting has become a critical component of modern IT operations. Without accurate metrics, organizations operate on assumptions rather than evidence.
Effective Service Desk Reporting Metrics help organizations move beyond simply tracking tickets and start measuring service quality, efficiency, and business impact. In this blog, we'll explore the most important metrics every service desk should monitor, how these metrics support better decision-making, and practical ways to build a reporting framework that drives continual improvement. We'll also discuss common reporting challenges, best practices, and how modern IT Service Desk Reporting is evolving with automation and AI.
Service Desk Reporting Metrics are measurable indicators used to evaluate the performance, efficiency, and effectiveness of an IT service desk. These metrics provide insights into how well support teams are handling incidents, service requests, and user interactions.
Effective IT Service Desk Reporting transforms raw operational data into meaningful information that helps organizations:
Rather than focusing solely on ticket volumes, modern reporting metrics provide a comprehensive view of service quality and business impact.
Many organizations collect large volumes of service desk data but fail to use it strategically. This often results in missed opportunities for improvement.
Strong Service Desk Reporting enables organizations to:
| Benefit | Impact |
| Improved Visibility | Understand overall service desk performance |
| Better Decision-Making | Make data-driven operational improvements |
| Enhanced Customer Experience | Identify service gaps affecting users |
| Resource Optimization | Allocate staff effectively |
| SLA Compliance | Monitor and improve service commitments |
| Continuous Improvement | Identify trends and recurring issues |
When reporting is aligned with business objectives, IT leaders gain valuable insights that support strategic planning and operational excellence.
Not all metrics provide equal value. Organizations should focus on metrics that directly influence service quality, efficiency, and customer experience.
First Contact Resolution measures the percentage of incidents resolved during the initial interaction without escalation or follow-up.
Why It Matters
Higher FCR rates indicate:
Formula
FCR = (Tickets Resolved on First Contact ÷ Total Tickets) × 100
Organizations with strong Service Desk Reporting Metrics often prioritize improving FCR because it directly impacts both efficiency and user experience.
This metric measures the average time required to fully resolve incidents or service requests.
Why It Matters
Monitoring resolution time helps organizations:
Consistently long resolution times may indicate staffing shortages, knowledge gaps, or process inefficiencies.
Mean Time to Resolve is one of the most widely used IT Service Desk Reporting metrics.
It measures the average time taken to restore service after an incident occurs.
Benefits
A lower MTTR typically indicates a more mature and responsive service desk operation.
Ticket volume tracks the number of incidents and service requests received over a specific period.
Why It Matters
Analyzing ticket volume helps organizations:
Effective Service Desk Reporting Metrics often reveal patterns that can help prevent future incidents before they occur.
SLA compliance measures whether support teams meet agreed service targets.
Examples include:
Key Benefits
Consistent SLA achievement is a strong indicator of service desk maturity.
Customer Satisfaction Score measures how users feel about the support they receive.
Typically collected through post-resolution surveys, CSAT provides direct feedback from end users.
Common Survey Question
"How satisfied were you with the support provided?"
Why CSAT Matters
Even if technical metrics appear strong, poor customer satisfaction can indicate deeper service issues.
A balanced Service Desk Reporting strategy combines operational metrics with customer-focused measurements.
A ticket backlog refers to unresolved tickets waiting for action.
Monitoring Backlogs Helps:
Growing backlogs often indicate resource constraints or process inefficiencies.
Escalation rate measures the percentage of tickets requiring higher-level support.
Benefits of Tracking Escalations
Organizations using advanced Service Desk Reporting Metrics often use escalation analysis to enhance team performance.
A reopened ticket is one that was marked resolved but later reopened due to incomplete resolution.
Why It Matters
High reopening rates may indicate:
Tracking this metric helps improve resolution quality.
Modern service desks increasingly rely on self-service portals and knowledge bases.
This metric measures how frequently users solve issues independently without contacting support.
Benefits
High self-service adoption is often a sign of effective knowledge management.
Simply collecting metrics is not enough. Organizations must establish a structured reporting framework.
Ask:
For example:
| Business Goal | Relevant Metric |
| Improve Customer Experience | CSAT, FCR |
| Reduce Downtime | MTTR |
| Increase Efficiency | Resolution Time |
| Lower Costs | Self-Service Adoption |
Avoid reporting metrics that do not drive decisions.
Good metrics should:
Dashboards make IT Service Desk Reporting easier to interpret.
Popular dashboard components include:
Visual reporting helps leadership identify issues quickly.
Reporting should not be a monthly formality.
Organizations should:
Regular reviews transform reporting into meaningful action.
Many of the reporting practices discussed above are rooted in proven IT service management principles. If you're looking to understand how service reporting, continual improvement, service value streams, and performance measurement fit within the broader ITIL framework, exploring the ITIL 5 Exam Syllabus can provide valuable insights into the core concepts and competencies expected from modern IT service management professionals.
Despite its importance, many organizations face reporting challenges.
Too many metrics can create confusion.
Solution:
Focus on KPIs that directly support business objectives.
Poor ticket categorization often leads to unreliable reports.
Solution:
Establish clear data-entry standards and governance processes.
Numbers alone rarely tell the complete story.
Solution:
Combine quantitative metrics with qualitative insights from users and support teams.
Reports that are never reviewed provide little value.
Solution:
Assign accountability and create improvement plans based on findings.
To maximize the value of Service Desk Reporting Metrics, organizations should adopt proven best practices:
Organizations that treat reporting as a strategic capability rather than an administrative task often achieve significantly better service outcomes.
The future of IT Service Desk Reporting is increasingly driven by automation, artificial intelligence, and predictive analytics.
Emerging capabilities include:
These innovations enable service desks to move beyond reactive support and become proactive business partners.
As organizations continue to digitize operations, data-driven decision-making will become even more critical. For professionals considering certification as part of their career growth or organizational upskilling initiatives, understanding the ITIL 5 Cost can help in planning training investments while evaluating the long-term value that ITIL knowledge brings to service desk performance, reporting maturity, and continual service improvement.
In today's experience-driven digital landscape, successful IT service desks are not defined by the number of tickets they close they are defined by the value they deliver. Without meaningful measurement, even the most hardworking support teams can struggle to identify inefficiencies, justify investments, or demonstrate their impact on business outcomes.
This is where Service Desk Reporting Metrics become indispensable. They provide the visibility needed to move from reactive support to proactive service management, enabling organizations to make informed decisions, improve service quality, and create better experiences for employees and customers alike. Professionals seeking to master service management principles and reporting best practices can further enhance their capabilities through structured learning such as NovelVista's ITIL 5 Foundation Certification, which provides practical insights into delivering, measuring, and improving modern IT services

Whether it's improving First Contact Resolution, reducing MTTR, maintaining SLA compliance, or enhancing customer satisfaction, effective Service Desk Reporting turns operational data into a roadmap for continual improvement. More importantly, it helps IT leaders align service desk performance with broader organizational goals such as productivity, cost optimization, operational resilience, and digital transformation.
As businesses become increasingly dependent on technology, the role of data-driven decision-making will only continue to grow. Organizations that embrace comprehensive IT Service Desk Reporting practices today will be better equipped to anticipate challenges, optimize resources, elevate service delivery, and build a service desk that serves as a strategic business enabler rather than simply a support function.
The question is no longer whether you should measure service desk performance it is whether you are measuring the metrics that truly matter.
Author Details

Course Related To This blog
ITIL4 Specialist Monitor Support and Fulfil Certification
ITIL4 Specialist Acquiring & Managing Cloud Services
ITIL 4 Specialist Sustainability in Digital & IT
ITIL® 4 Strategic Leader Digital And IT Strategy (DITS)
ITIL® 4 Specialist Drive Stakeholder Value
ITIL® 4 Specialist High Velocity IT
ITIL® 4 Specialist Create Deliver & Support
ITIL® 4 Foundation Certification
Confused About Certification?
Get Free Consultation Call
Stay ahead of the curve by tapping into the latest emerging trends and transforming your subscription into a powerful resource. Maximize every feature, unlock exclusive benefits, and ensure you're always one step ahead in your journey to success.