Category | DevOps
Last Updated On 29/07/2026
Nearly 90% of users abandon an app after repeated performance problems, and a single hour of downtime can cost an enterprise millions in lost revenue and trust. As systems move to microservices, multi-cloud, and global scale, "just keep it running" stops being a strategy.
This is the problem Site Reliability Engineering (SRE) was built to solve, and the SRE pillars are the operating system behind it. In this guide, you'll get a complete, practical breakdown of:
This guide is written for DevOps engineers, SRE practitioners, engineering managers, and technology leaders who want to engineer reliability rather than hope for it.
Site Reliability Engineering (SRE) is a discipline, pioneered at Google, that applies software engineering practices to IT operations. Instead of operations teams reacting to outages after the fact, SRE teams treat reliability as an engineering problem: they measure it, set targets for it, and build automation to sustain it.
The distinction that matters most in practice: DevOps is a culture and set of practices focused on collaboration and speed between dev and ops. SRE is one concrete, measurable way of implementing that culture with specific metrics, roles, and guardrails. The pillars of SRE are what make that measurement possible.
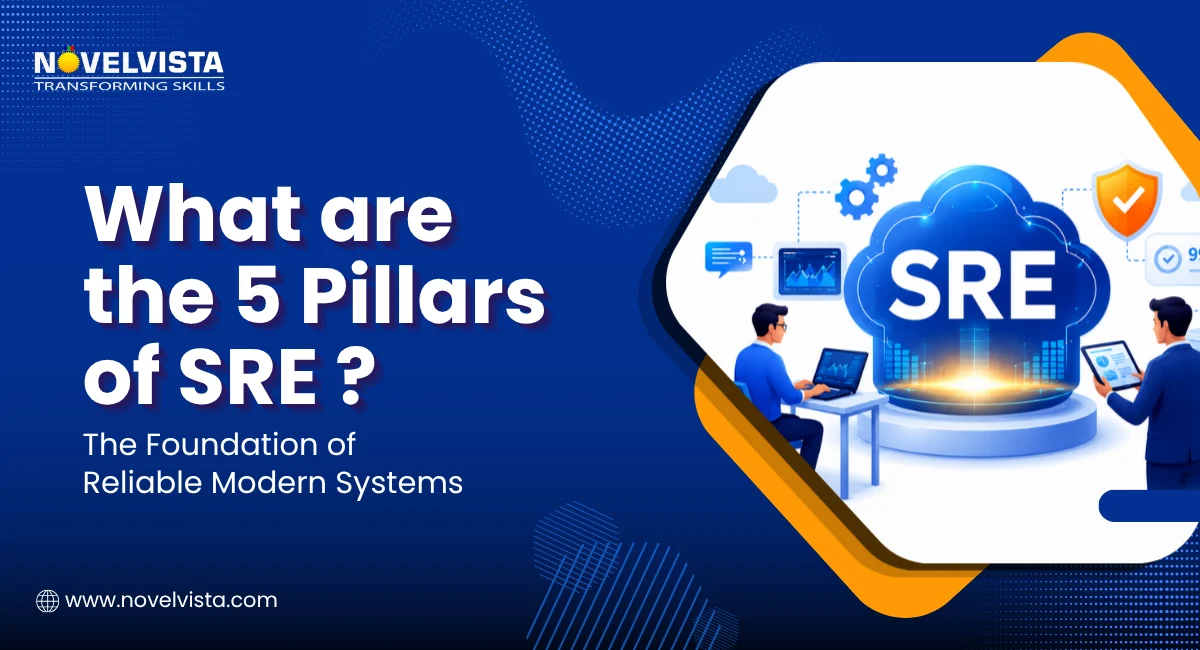
The SRE pillars are the foundational practices that define how reliability is measured, protected, and improved over time. Rather than chasing "100% uptime," they balance user experience, engineering velocity, and operational cost.
If you research this topic, you'll notice the number of pillars isn't fixed; different sources present anywhere from 3 to 9.
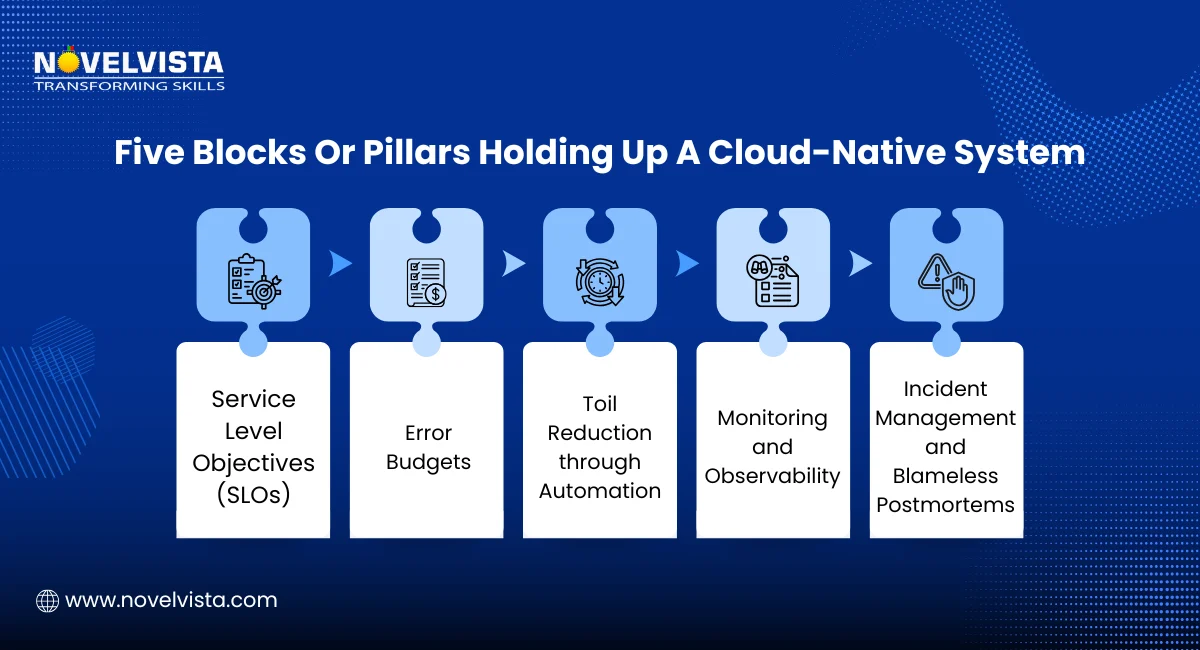
There's no single official number; it's a framework, not a spec. What matters is that your team covers the underlying capabilities. Below is the 5-pillar model, which is the most widely taught starting point.
SLOs define the target reliability of a service from the user's point of view, not the server's. They're built on two supporting concepts:
For example, a checkout API might have an SLI of "% of requests under 300ms," an internal SLO target of 99.9% over 30 days, and a customer-facing SLA of 99.5%. The gap between SLO and SLA is intentional buffer room.
Why it matters: SLOs stop reliability debates from being subjective ("it feels slow") and turn them into data. They also prevent over-engineering; you don't need five nines for a service where users won't notice the difference between 99.9% and 99.99%.
Common tools: Google Cloud SLO Monitoring, Nobl9, Datadog SLO tracking, Prometheus + Grafana dashboards.
An error budget is simply 100% − SLO. If your SLO is 99.9% availability, your error budget is 0.1%, roughly 43 minutes of allowed downtime per month.
This budget becomes a shared decision-making tool between product and engineering:
This is what separates SRE from traditional "zero-defect" operations thinking; it explicitly embraces risk instead of pretending failure is avoidable and uses data instead of politics to decide when to slow down.
This pillar gives teams visibility into system health, but it's actually two related capabilities:
Because observability is deep enough to be its own discipline, it has its own set of pillars covered in detail in the next section.
Common tools: Prometheus, Grafana, Datadog, New Relic, Honeycomb, OpenTelemetry, Splunk.
Failures are inevitable at scale; this pillar is about how fast and how cleanly a team recovers from them. Mature incident management includes the following:
The goal isn't zero incidents (that's not realistic); it's shrinking MTTD (mean time to detect) and MTTR (mean time to resolve) and making sure the same incident doesn't repeat.
Common tools: PagerDuty, Opsgenie, Incident.io, Jira Service Management, Statuspage.
"Toil" is manual, repetitive operational work that scales linearly with system growth and adds no lasting engineering value, like restarting services, manually provisioning environments, or running the same deployment checklist by hand.
This pillar focuses on automating that work away:
Reducing toil isn't just about efficiency; it frees SREs to spend time on the engineering half of "Site Reliability Engineering" rather than being permanent on-call firefighters.
Mastering these five pillars is also the foundation for the technical and soft skills covered in our guide to SRE engineer skills & requirements.
Because "monitoring and observability" gets compressed into a single line item in most SRE pillar lists, it's worth breaking observability out on its own, especially since it's commonly searched as its own topic: the SRE observability pillars.
Observability is built on three types of telemetry data, often called the "golden triangle" of observability:
Numeric measurements captured over time: request rate, error count, CPU utilization, and latency percentiles (p50/p95/p99). Metrics are cheap to store, easy to aggregate, and ideal for dashboards and alerting thresholds. Tools: Prometheus, CloudWatch, Azure Monitor.
Timestamped, discrete records of events within a system: an error stack trace, a request log line, an auth failure. Logs give you the granular detail metrics can't: the exact request that failed and why. Tools: ELK Stack (Elasticsearch/Logstash/Kibana), Splunk, Loki.
A trace follows a single request as it moves across multiple services in a distributed system, showing where time was spent and where it failed. In a microservices architecture, this is often the only way to answer "which of our 40 services caused this slowdown?" Tools: Jaeger, Zipkin, OpenTelemetry, Honeycomb.
Why this distinction matters for SRE specifically: monitoring tells you a checkout service is slow; observability via traces and logs lets you follow that request across services, find the failing dependency, and understand why it's slow, without needing to have predicted that exact failure mode in advance. Google's SRE book explicitly ties observability goals back to SLOs: the data you collect should exist to answer, "Are we within our reliability target?" not to generate noise.
No single one of these three pillars is sufficient on its own; metrics tell you something changed, logs tell you what happened, and traces tell you where in the system it happened. Mature SRE observability stacks correlate all three.
If you dig into extended frameworks (some vendor content lists up to 9 pillars of SRE), two additional practices show up consistently and deserve a mention even if they don't make every "top 5" list:
Think of these as extensions of the automation and error budget pillars rather than entirely separate categories, but they're worth building into your reliability program as it matures.
Pillar | Core Question It Answers | Key Metric | Common Tools |
| SLOs & SLIs | What reliability level do users actually need? | Latency, error rate, availability percentage | Nobl9, Datadog SLOs, Grafana |
| Error Budgets | How much risk can we afford right now? | Remaining budget %, burn rate | Custom dashboards, Google SLO tooling |
| Monitoring & Observability | Is something wrong, and why? | MTTD, alert noise ratio | Prometheus, Grafana, Honeycomb, OpenTelemetry |
| Incident Management | How fast do we detect and recover? | MTTR, incident recurrence rate | PagerDuty, Opsgenie, Incident.io |
| Automation & Toil Reduction | What manual work can we eliminate? | Toil % of engineering time | Terraform, Ansible, CI/CD pipelines |
The pillars aren't independent checkboxes; they're a feedback loop. SLOs define what "reliable" means. Error budgets translate that into a risk tolerance the whole team can act on. Observability tells you where you stand against that budget in real time. Incident management kicks in when things go wrong, and postmortems feed lessons back into better SLOs and more automation.
Skip one pillar and the others weaken. Strong observability without a defined SLO just produces noisy dashboards nobody acts on. A generous error budget without real incident response processes just means outages linger longer than they should. In most real-world outage postmortems, the root cause traces back to a missing or weak pillar, not a single freak failure.
Implementing the SRE pillars pays off well beyond uptime metrics:
You don't need to implement all five pillars simultaneously. A practical sequence:
This progression also forms the foundation of a broader SRE roadmap for teams moving from ad-hoc reliability practices to a mature, scalable program.
The SRE pillars - SLOs, error budgets, observability, incident management, and automation- give organizations a structured, measurable way to build reliable systems instead of hoping nothing breaks. Observability, in particular, deserves its own attention: understanding the three observability pillars of metrics, logs, and traces is what makes the rest of the framework actionable.

Whether you're working with 5 pillars or a more detailed 9-pillar breakdown, the underlying goal is the same: make reliability measurable, make trade-offs explicit, and make recovery fast. Done well, this isn't just an operational improvement; it's a business advantage.
Boost your SRE expertise with NovelVista's SRE Foundation and SRE Practitioner Training & Certification. Designed for DevOps engineers, SRE practitioners, and IT leaders, these courses offer practical skills, real-world case studies, and globally recognized credentials.
Start your SRE learning journey today!
SRE pillars are the foundational practices - SLOs, error budgets, observability, incident management, and automation - that help teams engineer, measure, and continuously improve system reliability.
The most widely taught model includes (1) Service Level Objectives, (2) Error Budgets, (3) Monitoring and Observability, (4) Incident Management and Response, and (5) Automation and Toil Elimination. Some frameworks extend this to include capacity planning and change management as additional pillars.
Observability itself is built on three pillars: metrics (numeric measurements over time), logs (discrete event records), and traces (the path of a request across distributed services). Together they let engineers diagnose issues that weren't predicted in advance.
No. The count varies by source; some models use 3, most common explainers use 5, and some extended vendor frameworks list up to 9 by separating capacity planning, change management, and disaster recovery. There's no single official number; what matters is covering the underlying capabilities.
No. Startups and mid-size teams benefit from applying SRE pillars early- even a lightweight version (basic SLOs, simple on-call rotation, minimal automation) improves reliability and scales more easily than retrofitting these practices later.
DevOps is a broader cultural and collaboration philosophy focused on speed between dev and ops teams. SRE pillars are a specific, measurable implementation of that philosophy, built around metrics like SLOs, error budgets, and MTTR.
In microservices and cloud-native environments, failures often occur across service boundaries that basic monitoring can't explain. The three observability pillars — metrics, logs, and traces — enable engineers to trace a failure across dozens of interdependent services rather than guessing.
Author Details

Confused About Certification?
Get Free Consultation Call
Stay ahead of the curve by tapping into the latest emerging trends and transforming your subscription into a powerful resource. Maximize every feature, unlock exclusive benefits, and ensure you're always one step ahead in your journey to success.