Category | IT Service Management
Last Updated On 10/07/2026

Network availability looks simple until someone asks, “Were we actually available to users?” This guide explains how to calculate network availability with ITIL Availability Management, including uptime, downtime, SLA targets, MTBF, MTRS, reporting, common mistakes, and practical improvement steps for network teams.
Network availability is the percentage of agreed service time during which the network service is usable for the people or systems that depend on it. In ITIL, the focus is not only whether a router, switch, firewall, or link is powered on. The real question is whether the service is available at the level the business agreed to.
That distinction matters. A core switch might show 100% device uptime, yet users may still be unable to access business applications because DNS, VPN, WAN routing, authentication, or internet breakout has failed. From a user and business viewpoint, the network is not available.
So, network availability should be measured against three things:
ITIL Availability Management helps IT teams define this clearly before the calculation begins.
Network teams often track outages after something breaks. That is useful, but it is not enough. ITIL Availability Management adds a structured way to plan, measure, review, and improve availability so network reliability supports business priorities.
For example, a trading platform, hospital system, cloud contact center, or payment gateway may need a much stronger availability target than a guest Wi-Fi network. ITIL encourages teams to align the cost of reliability with actual business value.
This is also where availability connects with other ITSM practices. Incident management restores service quickly. Problem management removes recurring causes. Service level management defines the SLA. Capacity management checks whether performance risks could become availability risks. Change management helps prevent outages caused by poorly planned network changes.
Organizations going through ITIL Transformation should treat network availability as a service outcome, not just a device metric.
Before you calculate availability, collect the right inputs. A weak calculation usually starts with unclear measurement rules.
You need:
One important rule: do not decide after the outage whether planned maintenance counts or not. The SLA must define that upfront.
The most common formula is:
Availability % = [(Total Scheduled Time - Downtime) / Total Scheduled Time] × 100
Here is what each part means:
If a network is expected to run for 10,000 minutes and has 50 minutes of unplanned downtime, the calculation is:
[(10,000 - 50) / 10,000] × 100 = 99.5%
That number is useful, but only when everyone agrees what downtime means. A full site outage, a degraded WAN link, a failed VPN gateway, and packet loss affecting a business app may need different treatment in the SLA.
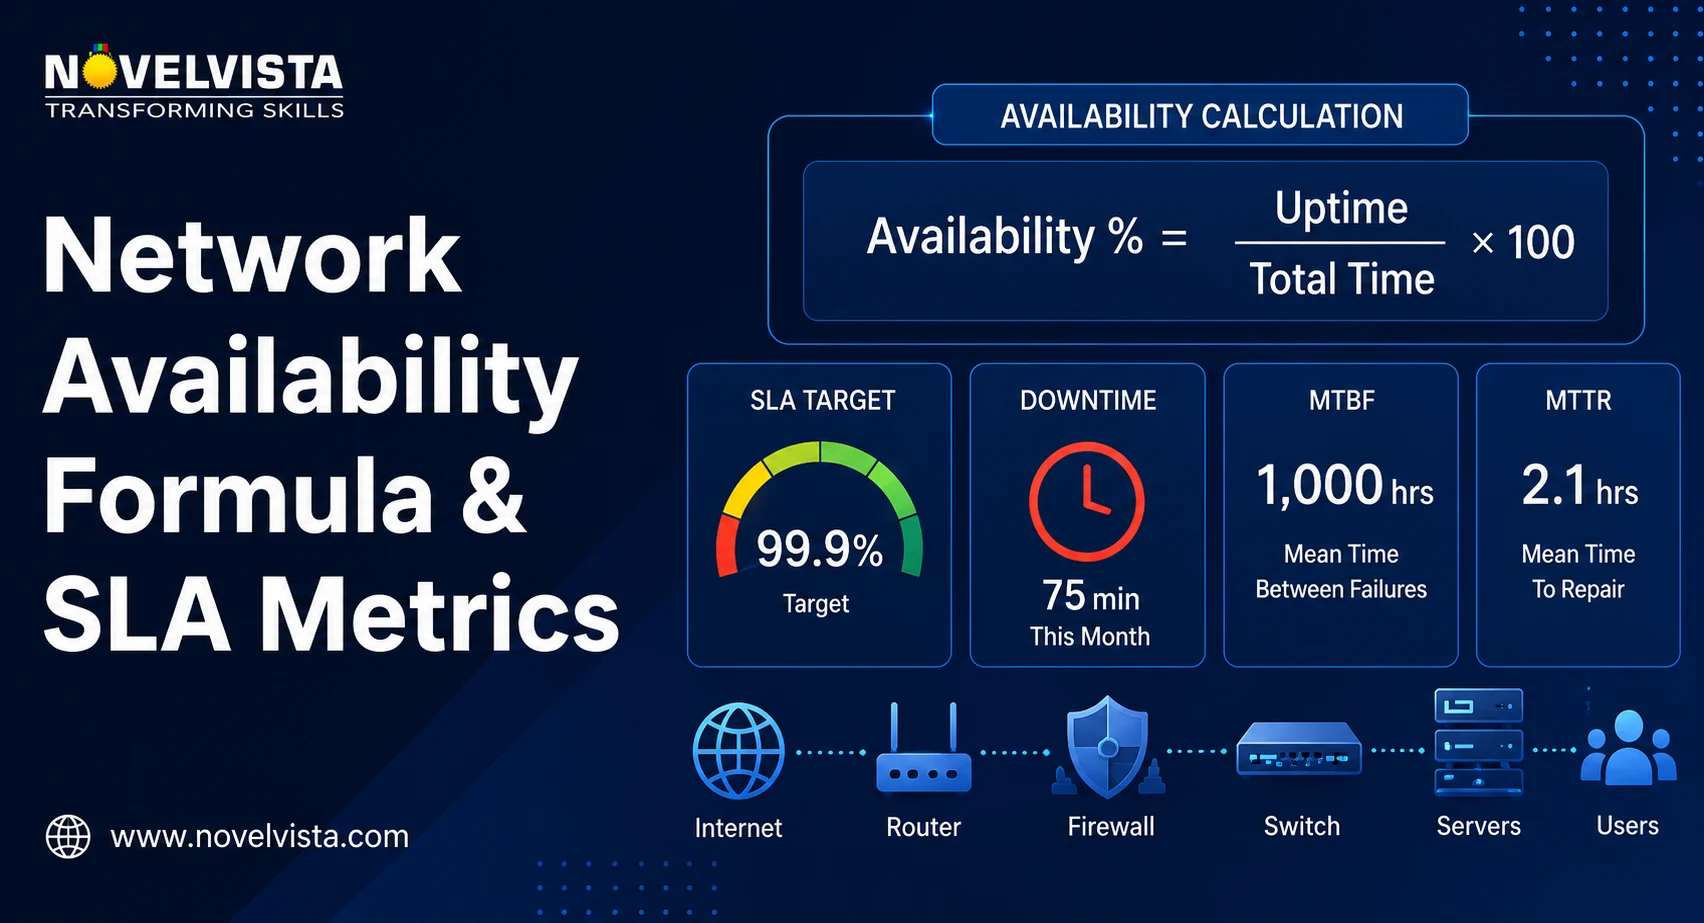
Let’s calculate availability for a 24x7 corporate network across a 30-day month.
A 30-day month has:
30 days × 24 hours × 60 minutes = 43,200 minutes
During the month, the network had three unplanned outages:
| Incident | Impact | Downtime |
|---|---|---|
| ISP link failure | Head office users affected | 25 minutes |
| Firewall failover issue | VPN users affected | 18 minutes |
| Core switch routing issue | Two departments affected | 32 minutes |
| Total | 75 minutes |
Now apply the formula:
Availability % = [(43,200 - 75) / 43,200] × 100
Availability % = 99.826%
If the SLA target was 99.9%, this result fails the SLA. The network was available most of the month, but it still exceeded the allowed downtime for a 99.9% monthly target.
| Metric | Value |
|---|---|
| Total scheduled time | 43,200 minutes |
| Total downtime | 75 minutes |
| Total uptime | 43,125 minutes |
| Availability achieved | 99.826% |
| SLA target | 99.9% |
| SLA status | Breached |
This is why ITIL Availability Management is helpful. It does not stop at the percentage. It asks what failed, why it failed, who was affected, and what should change.
Availability percentages can be misleading when people do not translate them into downtime. A small-looking decimal difference can mean a large operational difference.
| SLA Target | Approx. Allowed Downtime Per Month | Approx. Allowed Downtime Per Year |
|---|---|---|
| 99% | 7 hours 18 minutes | 3 days 15 hours 36 minutes |
| 99.5% | 3 hours 39 minutes | 1 day 19 hours 48 minutes |
| 99.9% | 43 minutes 50 seconds | 8 hours 45 minutes 57 seconds |
| 99.99% | 4 minutes 23 seconds | 52 minutes 35 seconds |
| 99.999% | 26 seconds | 5 minutes 15 seconds |
The higher the target, the more expensive and complex the design becomes. Moving from 99.9% to 99.99% usually requires stronger redundancy, faster failover, better monitoring, tested recovery processes, and tighter supplier contracts.
So, do not choose “five nines” because it sounds impressive. Choose an availability target because the business impact justifies the investment.
Availability Management ITIL uses reliability and recovery metrics to explain why availability improves or drops. Three useful metrics are MTBF, MTRS, and MTTR.
A common reliability-based formula is:
Availability = MTBF / (MTBF + MTTR)
For example, if a network service has an MTBF of 1,000 hours and an MTTR of 2 hours:
1,000 / (1,000 + 2) = 0.998
That equals 99.8% availability.
This shows two improvement paths. You can increase MTBF by preventing failures through better design, maintenance, capacity planning, and supplier quality. You can reduce MTRS or MTTR through faster detection, escalation, runbooks, automation, and practiced recovery.
Availability Management ITIL is useful because it connects these metrics to real improvement decisions instead of leaving them as dashboard numbers.
A common mistake is measuring each network component separately and assuming the service is healthy. Network services are built from dependencies. A branch user may need the access switch, wireless controller, WAN router, ISP link, firewall, DNS, identity service, and cloud application path to work together.
If any critical dependency fails, the user may experience downtime even though most devices are available.
This is where dependency mapping matters. Network teams should identify:
A mature ITIL Transformation program uses these maps to move from isolated infrastructure reporting to end-to-end service reporting.
A good availability report should tell a business story, not just show a percentage. For instance, “99.9% availability” may sound acceptable, but if the downtime happened during payroll processing or peak customer traffic, the business impact may be serious.
Your report should include:
The best reports also show trends. If downtime is reducing month by month, the service is improving. If availability is stable but incident count is rising, the service may be becoming fragile.
Availability reporting goes wrong when teams measure what is easy instead of what matters. Watch out for these mistakes:
This practice works best when teams agree on measurement rules, keep consistent records, and review the numbers with business context.
The calculation is only the starting point. Once you know where availability is weak, the next step is improvement.
Practical improvement actions include:
This is also where ITIL Transformation becomes practical. The goal is not to create more reports. The goal is to make better service decisions from reliable data.
Use this checklist to keep the calculation clean and useful:
| Checklist Item | Why It Matters |
|---|---|
| Define agreed service hours | Prevents disputes about what counts |
| Confirm SLA targets | Sets the benchmark for success |
| Separate planned and unplanned downtime | Keeps reporting fair and transparent |
| Track outage start and end times | Improves calculation accuracy |
| Record user and business impact | Adds context beyond percentages |
| Measure MTBF and MTRS | Shows reliability and recovery strength |
| Map network dependencies | Finds hidden failure points |
| Review SLA breaches | Turns reporting into improvement |
| Track trends over time | Shows whether reliability is improving |
When this checklist becomes routine, availability reporting becomes much more credible.

Calculating network availability is not difficult once the rules are clear. Start with agreed service time, subtract downtime, apply the formula, and compare the result with the SLA target. Then go deeper by reviewing MTBF, MTRS, incident patterns, business impact, and end-to-end service dependencies.
The real value of ITIL Availability Management is that it turns uptime data into better decisions. ITIL Availability Management also gives teams a common language for reliability, recovery, and business impact.
For professionals and teams that want to build stronger IT service management capability, NovelVista offers learning paths that support practical ITIL adoption, service improvement, and structured ITSM thinking.
With the right measurement model and a service-focused mindset, your network availability numbers become more than monthly SLA evidence. They become a roadmap for better reliability, better planning, and better business outcomes.
Author Details

Course Related To This blog
ITIL V5 Foundation
Confused About Certification?
Get Free Consultation Call
Stay ahead of the curve by tapping into the latest emerging trends and transforming your subscription into a powerful resource. Maximize every feature, unlock exclusive benefits, and ensure you're always one step ahead in your journey to success.