Category | DevOps
Last Updated On 08/11/2025

Three seconds. That’s how long it takes for a user to abandon a slow-loading app. And in the era of global microservices, software doesn't politely fail anymore, it collapses like dominoes. A minor API latency spike becomes a checkout failure. A single misconfigured Kubernetes pod freezes a payment service. Welcome to modern production.
Here’s the reality:
We moved from monoliths to distributed systems faster than our ability to understand them.
“You can’t fix what you can’t see and in today’s cloud world, you see almost nothing by default.”
That’s why SRE Observability exists. Not to collect logs or stare at dashboards, but to predict, prevent, and eliminate failure before users ever feel it.
If DevOps accelerates delivery,
SRE Observability guarantees the runway never cracks under the speed.
This is more than uptime. It’s trust, revenue, performance, and engineering sanity.
Let’s break down how modern SRE teams turn chaos into clarity, data into decisions, and outages into opportunities to build undefeated systems.
Observability in SRE is the discipline of understanding the internal health and behavior of systems through the analysis of external outputs like logs, metrics, traces, and events. It empowers engineers to answer questions they didn’t predict in advance, especially during outages.
In simple terms:
Monitoring |
Observability |
Tells you when something is wrong |
Helps you understand why it's wrong |
Works with known issues |
Works for unknown/complex issues |
Static dashboards |
Dynamic querying, deep debugging |
Alerts based on thresholds |
Behavioral insights & anomaly detection |
For SREs, observability enables:
Observability in SRE is the backbone of modern reliability engineering.
Microservices
Applications are now split into dozens of services communicating through APIs.
Impact: A failure in one service can silently cascade, you need traces and dependency visibility to locate the weak link fast.
Serverless Functions
Functions trigger, scale, and disappear instantly in response to events.
Impact: Without observability, cold starts, throttling, or event failures become hidden bottlenecks affecting user experience.
Containers & Kubernetes
Workloads constantly shift with autoscaling, pod restarts, and rolling updates.
Impact: Traditional monitoring struggles with dynamic environments, real-time insights across clusters, nodes, and services are essential.
Distributed Data Pipelines
Modern systems rely on streaming platforms, ETL layers, and real-time analytics.
Impact: Lag, data loss, or processing delays can break business tasks — observability helps pinpoint where and why data flow stalls.
This brings agility and complexity. Traditional monitoring built for static environments fails here.
|
Benefit |
Impact |
|
Deep incident root-cause analysis |
Solve issues faster, reduce downtime |
|
SLO-driven engineering |
Align tech success with business success |
|
Predictive fault detection |
Prevent outages before customers see them |
|
Reduced alert noise |
Focus on meaningful signals |
|
Engineering productivity |
Less firefighting → more innovation |
With Observability SRE, you move from reactive firefighting to proactive resilience.
There’s often confusion around SRE vs Observability — let’s clear it up.
SRE
A discipline and engineering role focused on ensuring software systems are reliable, scalable, and efficient.
Goal: Balance innovation velocity with stability through SLOs, automation, and controlled risk.
A technical capability that reveals how systems behave internally by analyzing their external outputs.
Goal: Provide deep insight to debug, analyze performance, and understand system behavior in real time.
Applies SLOs, error budgets, automation, incident response, and capacity planning to keep services healthy.
Impact: Turns reliability into a measurable, proactive engineering function, not reactive firefighting.
Uses logs, metrics, traces, events, and real-time telemetry to surface unknown failure modes and performance anomalies.
Impact: Enables engineers to ask new questions and diagnose complex issues without guesswork.
SRE is a methodology and role, while observability is a data and insight capability used to support reliability.
In short: SRE defines the why and what of reliability; observability delivers the how to understand and solve problems.
SRE uses observability platforms, data, and insights to achieve uptime goals, enforce SLOs, and reduce MTTR.
Outcome: Faster root-cause analysis, improved user experience, and a system designed to learn from failure, not hide it.
Think of it like this:
Observability is the car dashboard.
SRE is the driver keeping the journey smooth.
Both are powerful alone, but unstoppable together.
Learn how top companies monitor, detect,
and fix issues before downtime hits.
Master observability tools, metrics, and best practices to stay ahead.
Structured/unstructured event data from applications and infrastructure.
Used for root-cause analysis & debugging.
Numeric time-series data about system performance.
Used for alerts, SLO/SLA measurement, capacity planning.
End-to-end requests flow across services.
Critical for microservices & distributed systems.
Changes in system state (deployments, scaling, config changes).
Helps correlate system behavior with operations.
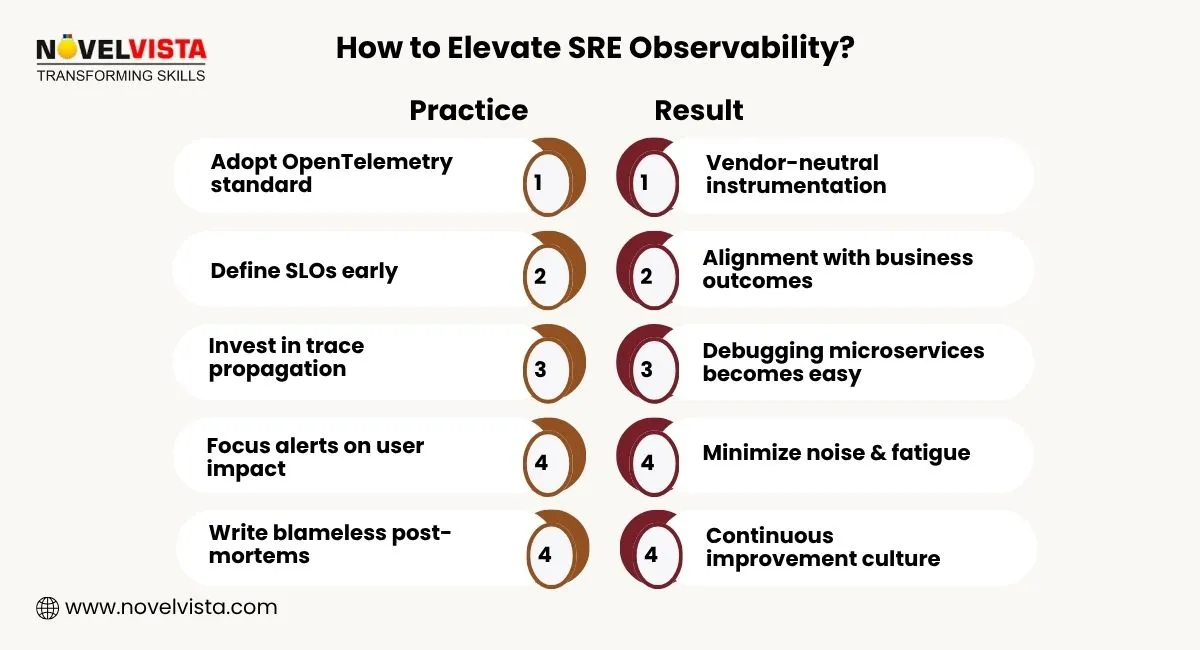
Applications and infrastructure are instrumented with structured logs, metrics, traces, and trace IDs. The goal is to capture every meaningful signal, event, and dependency path so issues can be observed from the inside out.
All telemetry data (from clusters, VMs, cloud services, APIs, and apps) is collected into centralized platforms. This unified data layer lets SREs analyze behavior across distributed systems rather than isolated components.
Dashboards, distributed trace maps, and live log streams bring metrics and events into one view. By correlating signals — latency spikes, errors, deployments, resource usage — SREs quickly see where and why issues occur.
SLIs such as latency, availability, error rates, and throughput are continuously monitored against SLOs. Alerts trigger only when real user-impact thresholds or error budgets are breached — reducing noise and focusing attention.
SREs run queries, inspect traces, and analyze logs to uncover patterns and pinpoint failure origins. This moves debugging from guesswork to data-driven, evidence-based resolution, especially in complex environments.
Playbooks, auto-scalers, and rollback mechanisms react automatically to defined conditions. Over time, observability insights power predictive automation — turning recurring fixes into autonomous responses.
In essence:
SRE Observability → Visibility → Insight → Diagnosis → Action → Automation → Resilience
Here are the leading platforms across categories:
Most organizations create a hybrid stack for their SRE Observability Tools.
Level |
Capability |
Outcome |
Level 1: Monitoring |
Basic dashboards & alerts |
Reactive firefighting |
Level 2: Observability |
Logs + Metrics + Traces |
Faster debugging |
Level 3: SRE Excellence |
SLOs, error budgets, automation |
Minimal downtime |
Level 4: AI-Driven Ops |
ML anomaly detection, auto remediation |
Autonomous reliability |
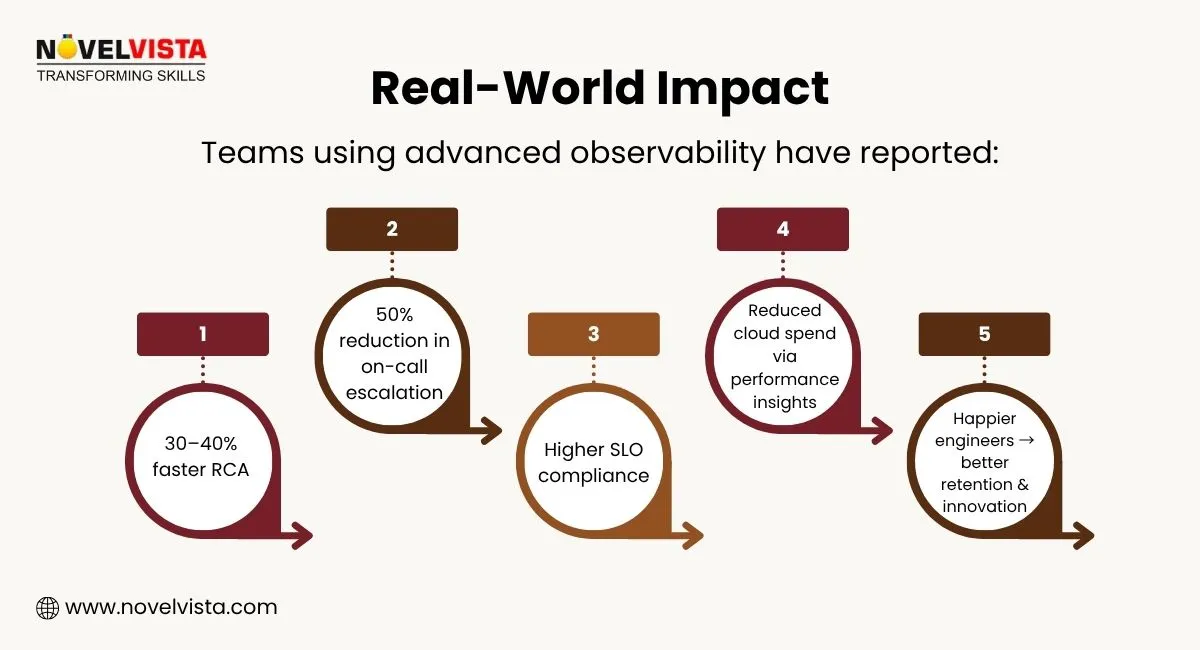
Reliability is no longer a “nice-to-have.” It’s the backbone of every digital business, from fintech apps moving billions to e-commerce platforms serving millions. And in this high-velocity, cloud-native world, Observability in SRE isn’t optional anymore, it’s the engine that keeps innovation safe, systems resilient, and users loyal.
The organizations that win are the ones that don’t just react to outages, they anticipate them, learn from every signal, and continuously build smarter, self-healing systems. That’s the power of pairing observability with SRE practices, automation, and a culture driven by SLOs and improvement. Teams that embrace this mindset don’t just keep services running, they move faster, fail safer, recover quicker, and deliver experiences users trust.
The future belongs to those who can see clearly, respond intelligently, and engineer reliability into everything they build.

Ready to accelerate your career in reliability engineering? Take the leap with NovelVista’s SRE Foundation Certification, designed to turn theory into real-world capability. Through expert-led training, guided labs, and practical case studies, you’ll learn how to build resilient systems, automate reliability, and drive uptime with confidence.
This is your chance to move beyond traditional operations and step into the future, where observability, automation, and engineering discipline come together to deliver unmatched performance.
Start your journey as a certified Site Reliability Engineer and unlock opportunities in leading tech-driven industries. Reliability leadership begins here.
Author Details

Confused About Certification?
Get Free Consultation Call
Stay ahead of the curve by tapping into the latest emerging trends and transforming your subscription into a powerful resource. Maximize every feature, unlock exclusive benefits, and ensure you're always one step ahead in your journey to success.