Category | DevOps
Last Updated On 20/11/2025
Reliability has become the lifeline of digital businesses. Users expect instant responses, zero lag, and seamless interactions, every single time. The moment an app slows down or a website crashes, trust evaporates. Research shows that 53% of users abandon a site if it takes longer than 3 seconds to load, and global downtime costs companies an average of $5,600 per minute. These numbers reinforce one thing: if you’re not tracking the right SRE KPI metrics, you’re operating blindly in a high-stakes environment.
Whether you're an SRE professional, DevOps engineer, platform architect, or a leader responsible for keeping services running smoothly, understanding sre kpi measurement is essential. This blog will help you unravel exactly what to measure, why it matters, and how to use these insights to improve system reliability and user experience.
Before jumping into the metrics, let’s first understand what we really mean when we talk about SRE KPI metrics.
SRE KPI metrics are measurable indicators that reflect the health, performance, stability, and reliability of a system. They help organizations answer critical questions: Are our services stable? How often do we fail? How fast do we recover? Are users experiencing slowdowns? Are we improving over time?
These KPIs connect engineering performance directly to user experience. When you track the right SRE metrics and KPIs, you gain the ability to predict system behavior, reduce incidents, plan capacity, and ensure your digital services remain dependable.
SRE is built around one core belief: you cannot improve what you cannot measure. These KPIs give teams the visibility needed to manage complexity and deliver consistent reliability.
If you're new to the reliability domain or want a clearer understanding of how SRE fits into modern technology environments, you can also explore our foundational article: What Is SRE in Technology?
Now, let’s explore the essential SRE KPIs every high-performing engineering team must track.
Availability is the simplest yet most crucial sre kpi. It represents the percentage of time your service is operational and accessible to users. This number often appears in terms like “three nines” (99.9%) or “five nines” (99.999%).
But the real insight comes from understanding how this number impacts your service:
This KPI ties your technical stability directly to business outcomes. Availability is not about perfection; it’s about predictability and meeting user expectations consistently.
No system is perfect. Incidents will happen. What matters is how quickly and effectively your team responds. That’s why incident metrics in SRE form one of the most critical categories of sre kpi metrics.
These metrics include:
Mean Time to Detect (MTTD)
This measures how long it takes for your monitoring system or your team to identify an issue. A high MTTD suggests gaps in observability or insufficient alerting.
Mean Time to Acknowledge (MTTA)
This metric reflects your on-call efficiency. It measures how quickly engineers acknowledge alerts. Slow responses usually hint at alert fatigue or overloaded teams.
Mean Time to Resolve (MTTR)
MTTR determines how long it takes to fully resolve an incident and restore normal service. It’s one of the strongest indicators of operational maturity.
Together, these incident metrics in SRE help highlight weak detection mechanisms, slow processes, staffing issues, or architectural problems. They also allow teams to benchmark improvements and evaluate how evolving systems behave under pressure.
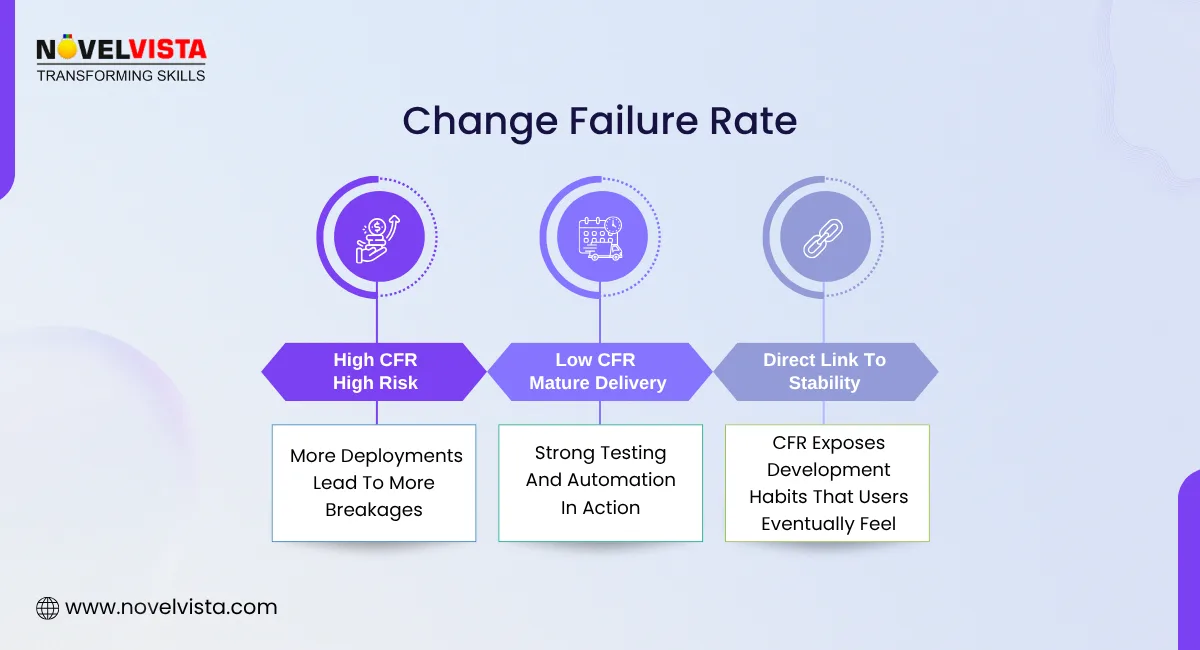
Every deployment introduces risk, no matter how advanced your pipeline is. The change failure rate (CFR) measures the percentage of releases that cause service degradation, rollbacks, or incidents.
This is one of the most revealing sre kpi indicators because it shows whether your development practices are helping or hurting your reliability.
If your CFR is high, several causes may be at play:
The change failure rate connects software delivery directly to system stability. A consistently low CFR signals strong engineering discipline and reliable delivery pipelines.
A system may technically be “up,” but if it’s unbearably slow, users won’t stick around. As a result, latency becomes one of the most essential SRE metrics and KPIs. High latency often goes unnoticed by alerts but is strongly felt by users. By monitoring response time distribution, not just averages, teams gain a deeper understanding of consistency and real-world performance.
Error rate measures the proportion of failed requests out of total requests, and these failures may originate from exceptions, timeouts, server overload, throttling, or dependency issues. This metric is crucial because users often experience errors before they even notice downtime, making it a highly sensitive indicator of system health. A sudden spike in error rate usually signals early system degradation, giving teams a chance to react before the issue escalates. Since error rate directly influences customer satisfaction, monitoring it helps engineering teams detect problems faster, identify bottlenecks, and ensure that the system consistently delivers valid responses under different load conditions.
Error budgets are the beating heart of SRE. They define how much unreliability is acceptable while still meeting business expectations.
If your SLO specifies 99.9% availability, your allowed downtime (your error budget) is 0.1%. Once this budget is exhausted, the team must shift focus from feature delivery to reliability improvements.
This makes error budgets a strategic kpi sre metric because they balance two competing priorities:
This approach ensures reliability investments are made at the right time and for the right reasons.
Reliability isn’t just a technological outcome; it’s also a human one. When on-call teams are overloaded, dealing with poor alert hygiene, or facing uneven shift distributions, overall system reliability can suffer. Tracking on-call workload helps you understand whether teams are experiencing alert fatigue, how often after-hours interruptions occur, and how effectively responsibilities are being shared across engineers. It also reveals whether your staffing levels are adequate for the complexity of your system. Ultimately, healthy engineers build healthy systems, which is why this human-centered KPI is just as important as any other SRE KPI metrics you monitor.
If you're considering a future in the reliability domain or curious about the evolving expectations from engineers, explore our complete breakdown of the SRE Engineer role, required skills, and career path to see how modern teams operate and grow.
Get the Free Beginner-Friendly Guide that Breaks Down
Every KPI with Clarity and Real-World Examples.
Not every organization needs every KPI. The key is selecting the right metrics and KPIs that align with your business model, customer expectations, architecture, and growth stage.
Reliability engineering is dynamic; your KPIs should evolve along with your architecture, scale, and product goals.
You can dive deeper into these essential indicators in our detailed guide on the Golden Signals in SRE, which breaks down how they shape proactive monitoring and system health.
Systems today are more distributed, more complex, and more interconnected than ever before. With microservices, cloud-native architectures, and global traffic, failures are not “if” but “when.”
Strong SRE KPI metrics help teams:
Without the right KPIs, you're simply reacting. With them, you're leading.
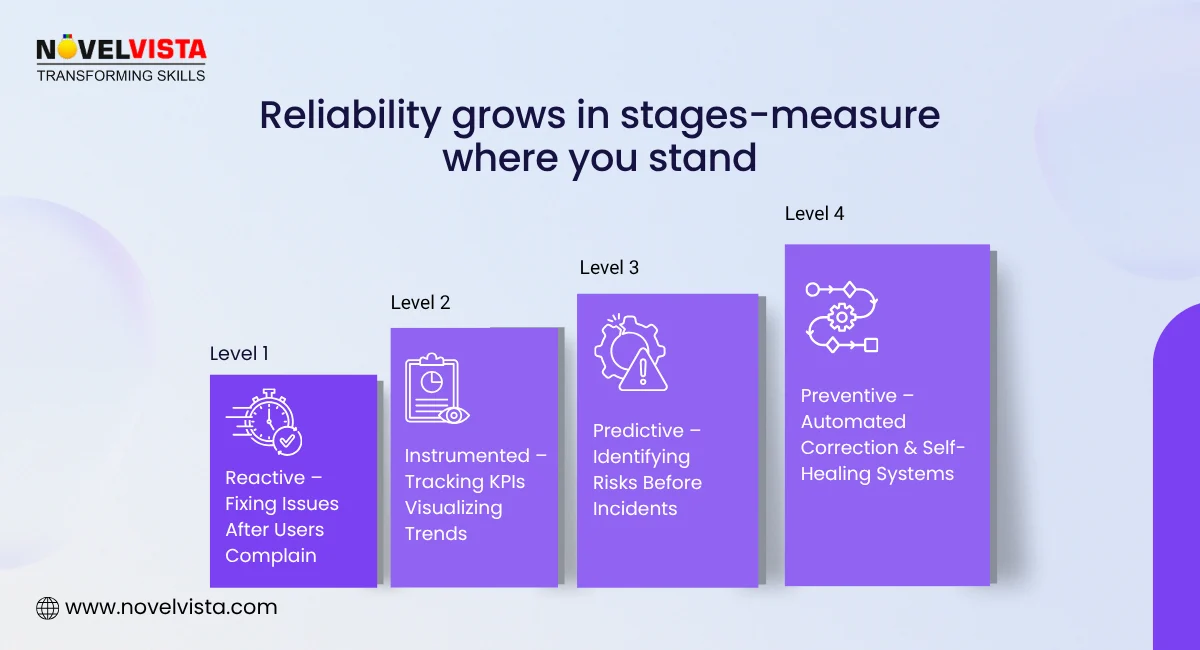
Reliability doesn't happen by accident; it happens through measurement, insight, and continuous improvement. When teams master sre kpi metrics, they gain the power to build systems that are fast, stable, predictable, and resilient.
Whether you're tracking incident metrics in SRE, analyzing availability trends, monitoring error rates, or managing on-call load, the right KPIs help you make smarter decisions and deliver world-class digital experiences.
Great reliability comes from knowing exactly where your system stands, and where it needs to go next.
If you're serious about mastering SRE practices and driving world-class reliability, it's time to take the next step. Join Novelvista's SRE Foundation Training & Certification and gain hands-on expertise in SRE principles, incident management, reliability engineering, SLOs/SLIs, automation, and modern service operations. Designed for IT professionals, DevOps engineers, and reliability-focused teams, this course gives you the practical frameworks and confidence you need to operate high-availability systems in today’s digital-first world.
Start your SRE career journey today and become the reliability leader your organization needs!

Author Details

Confused About Certification?
Get Free Consultation Call
Stay ahead of the curve by tapping into the latest emerging trends and transforming your subscription into a powerful resource. Maximize every feature, unlock exclusive benefits, and ensure you're always one step ahead in your journey to success.