Category | DevOps
Last Updated On 29/12/2025

Imagine this: your app is running smoothly, traffic looks normal, and everything appears stable — until suddenly, alerts explode, users start complaining, and dashboards turn red. This isn't bad luck; it's what happens when systems grow faster than monitoring practices. A recent enterprise study found 89% of outages stem from missed early warning signals, proving modern reliability isn’t optional; it’s mission-critical.
This is where Golden Signals SRE becomes your superpower.
Whether you're a Site Reliability Engineer, DevOps professional, cloud architect, or IT engineer transitioning into SRE, mastering Golden Signals SRE ensures you can detect failures early, respond faster, and scale confidently. It isn’t just a monitoring model; it’s a reliability mindset used by global engineering teams, from Google to fintech unicorns to SaaS leaders.
By the end, you’ll not only understand the Golden Signals SRE, but also know how to apply them to real systems. But before we dive into the “how,” let’s first clarify what Golden Signals SRE really means.
Golden Signals SRE is a monitoring framework created by Google’s Site Reliability Engineering team to track the four most critical metrics that reflect system health and user experience. Instead of drowning in dashboard noise or reacting to alarms too late, these four signals help you detect issues before they impact users.
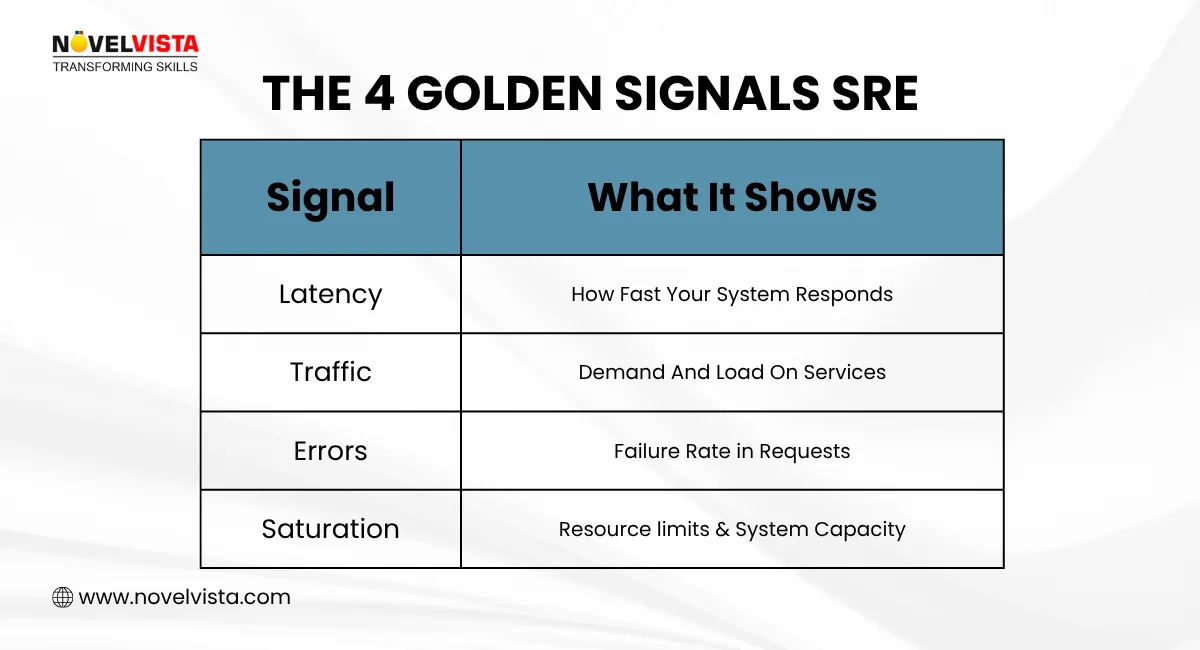
The 4 Golden Signals SRE include:
Distributed systems are powerful — but complex. Microservices talk to microservices, databases sync across regions, autoscaling adjusts capacity, and workloads spike instantly. Without the discipline of Golden Signals SRE, teams often end up reacting to outages instead of preventing them.
Simply put, mastering Golden Signals SRE makes systems predictable, resilient, and cost-efficient.
Golden Signals are one part of a broader observability ecosystem. If you want to understand how logs, metrics, traces, and monitoring tools work together, explore this detailed guide: Mastering SRE Observability: Why It Matters, How It Works & What Tools to Use
Let’s break down each signal with clear definitions, examples, and why they matter.
1. Latency — How Fast the System Responds
Latency measures how long a request takes to complete. If latency spikes, users feel slowness, spinning loaders, or eventual timeouts — a silent yet deadly indicator of system strain.
Examples of latency issues:
Slow dashboard load time: When analytics UI takes 8 seconds instead of 1, user frustration rises and engagement drops. This signals backend delays in API or database execution.
API response delays in checkout: A payment request that usually finishes in 400ms suddenly takes 2 seconds. This latency can break user trust and hurt conversion rates in ecommerce.
Key latency patterns to track:
Average & tail latency (P95/P99): Tail latency shows real peak issues — not just averages. Slowest users reveal where systems break first.
Success vs failure latency: Failed requests may return quickly but hide deeper problems. Measuring both exposes masked performance risk.
Golden Signals SRE Tip: Prioritize measuring latency per endpoint, not just overall. One slow endpoint can cascade across services.
2. Traffic — The Demand on Your System
Traffic shows how many requests hit your system — API calls, user visits, transactions, streaming messages, etc. Surge in traffic isn’t just about more users — it tests resilience, scalability, and architecture maturity.
Examples of traffic scenarios:
Product launch traffic spike: User sign-ups jump 10x within minutes, stressing application components. This tests autoscaling and caching layers in real time.
Streaming platform on sports finals day: Sudden viewers overload streaming nodes without proper load balancing. Traffic planning becomes make-or-break for experience.
Important values to monitor:
Requests per second (RPS): Helps scale infrastructure and anticipate traffic bursts.
Concurrency & client connections: Too many active users crash weak connection pools.
4 Golden Signals SRE Tip: Map traffic vs latency. Higher traffic with rising latency means overload – lower traffic with rising latency means internal failure.
3. Errors — How Often the System Fails
Errors represent failed user requests — visible failures like HTTP codes or internal failures like timeouts. In SRE, error rates matter because even tiny failures multiply at scale.
Examples of error patterns:
API returning 500 or 502 errors: Indicates backend or gateway failures affecting core transactions. Users experience broken flows and service disruption.
Payment retries are increasing suddenly: Could be a gateway outage or a database lock. Each failure reduces revenue opportunities and breaks trust.
Metrics to watch:
HTTP 4xx and 5xx patterns: Validates whether failures are system-side or user requests.
Retry rate & timeout frequency: High retry traffic can amplify failure loops in distributed systems.
SRE four golden signals rule: Pair error logs with traces to quickly pinpoint failing microservices.
4. Saturation — How Close You Are to Breaking Point
Saturation measures resource limits — CPU, memory, I/O, queues, and database connections. Even when everything appears fine, saturation silently builds until a crash hits.
Examples of saturation indicators:
CPU 90% for sustained minutes: Leaves no room for spikes or background tasks. Performance dips follow rapidly.
Database connection pool exhausted: Incoming queries queue and timeout, freezing user flows instantly.
Core saturation checks:
Resource usage trends over time: Seeing growth early helps plan scaling before a crisis.
Queue depth & processing lag: Queues are early warning systems for bottlenecks in async workloads.
Golden Signals SRE Advice: Focus on “saturation rate” — how fast you approach limits, not just the limit itself.
Modern observability stacks make the 4 golden signals SRE framework easy to adopt.
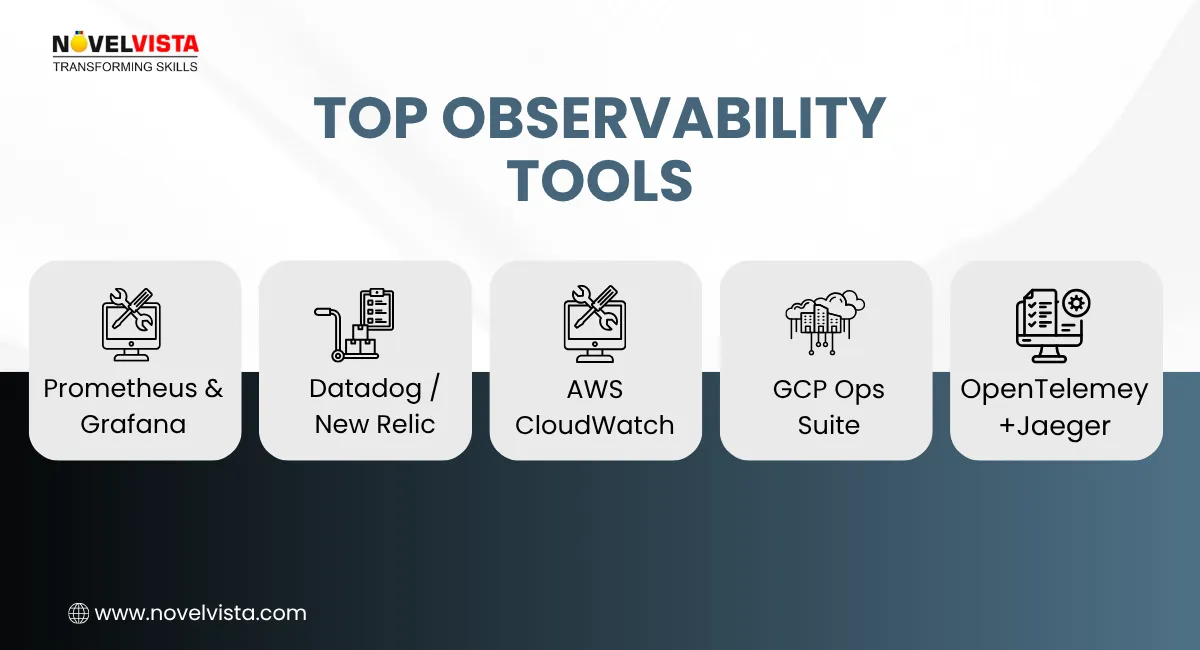
Each tool aligns perfectly with the SRE four golden signals, enabling automated insights and fast troubleshooting.
To ensure the Golden Signals SRE model delivers maximum reliability, follow these practices.
Set latency, error, and uptime goals based on real user needs.
This ensures engineering effort aligns with actual impact, not vanity metrics.
Avoid alarms for small fluctuations or temporary spikes.
Meaningful alerts reduce burnout and sharpen focus during real failure events.
Metrics show symptoms, logs explain behavior, tracing shows cause.
A unified approach transforms chaos into clarity during incidents.
Use autoscaling, auto-restart scripts and runbooks.
Automation shortens incident windows and increases engineer efficiency.
Chaos engineering reveals blind spots in observability.
Simulated failures strengthen reliability posture before real incidents occur.
This guide benefits professionals across tech roles.
Reliability isn’t luck — it’s discipline, visibility, and proactive engineering. The 4 golden signals SRE framework gives teams a powerful way to anticipate failures before they break the user experience. By focusing on latency, traffic, errors, and saturation, engineers create predictable, scalable, high-performance systems.
Mastering the SRE four golden signals will help you reduce outages, strengthen SLOs, improve incident response, and earn trust from users and leadership alike.
Adopt Golden Signals SRE today — your dashboards, your team, and your customers will feel the difference.

Join NovelVista’s SRE Foundation Certification Training and learn how modern engineering teams deliver fast, reliable, and scalable services. This program gives you hands-on exposure to SRE principles, Golden Signals monitoring, SLIs/SLOs, automation practices, and incident management workflows used by top tech companies.
Designed for DevOps engineers, IT operations professionals, developers, and cloud engineers, this course helps you adopt Google-born SRE methods and accelerate your reliability engineering career.
Start your SRE learning journey today and step confidently into the future of site reliability engineering!
Author Details

Confused About Certification?
Get Free Consultation Call
Stay ahead of the curve by tapping into the latest emerging trends and transforming your subscription into a powerful resource. Maximize every feature, unlock exclusive benefits, and ensure you're always one step ahead in your journey to success.